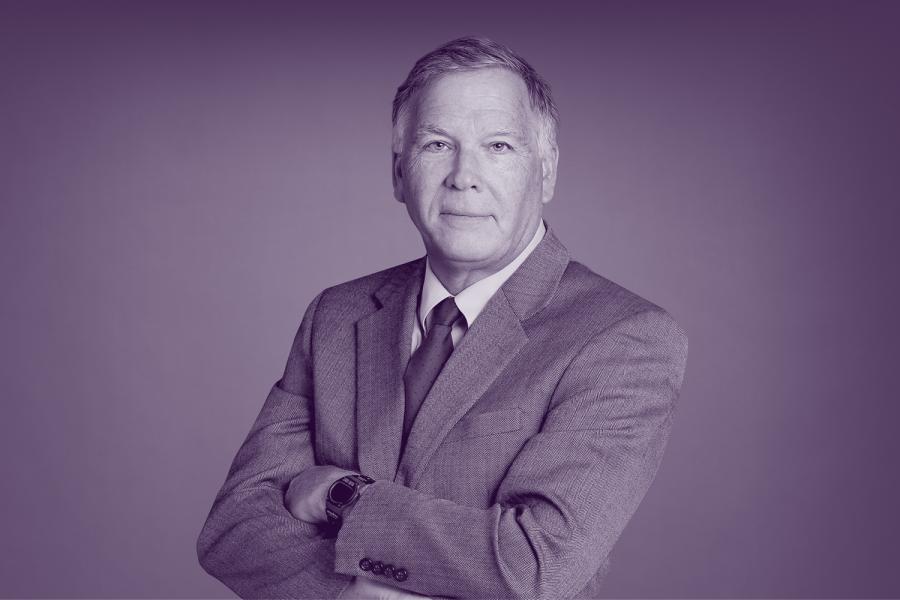
George D. Thurston

Biosketch / Results /

George D. Thurston

Professor;
Department of Environmental Medicine

Contact Info

Address
57 Old Forge Road
NYU Institute of Environmental Medicine Floor , gdt1@nyu.edu
Sterling Forest
Tuxedo, NY 10987

845-731-3564
845-351-5472
George.Thurston@nyumc.org


« Back to Results

Education

1976-1982 — Dr. Thurston received his Sc.D. from Harvard University School of Public Health|, Graduate Education
1982-1984 — Dr. Thurston was a Research Fellow at the Harvard University Kennedy School of Government's Energy and Environmental Policy Center, PostDoctoral Training

« Back to Results

Research Summary


In Dr. Thurston''s lab, we have identified associations between ambient air pollution and adverse human health effects. In our analyses, we considered individual subjects and their responses to ambient pollution, as well as citywide and nationwide population health characteristics and their aggregate associations with air pollution. Our studies have included both healthy and asthmatic children at summer camps in the northeastern United States, as these children are often outdoors and active during summer air-pollution episodes. Our studies of aggregate populations considered both human mortality, i.e., numbers of deaths per day by cause, and morbidity, e.g., numbers of hospital admissions per day for respiratory causes. We found that air pollution produces consistent adverse health consequences across the various populations and locations we researched. For example, on a high-ozone, air-pollution day, New York City hospital admissions for respiratory causes rise approximately 20% above otherwise expected figures. In the aftermath of 9/11, we also monitored the air pollution levels at the NYU Downtown Hospital near Ground Zero until the fires were extinguished, and have communicated this information at public forums we held in Lower Manhattan


Research Interests

Human Health Effects of Exposures to Air Pollutants

Research Keywords

acidic aerosols, air pollution, asthma, ozone, respiratory health

« Back to Results

All data from NYU Health Sciences Library Faculty Bibliography — -

Contact:
http://hsl.med.nyu.edu/faculty-bibliography-search#about

Corrigendum to "A source apportionment of U.S. fine particulate matter air pollution" [Atmos. Environ. 45/24 (2011) 3924-3936]
Thurston G.D.; Ito K.; Lall R.
2012 ;47:566-569, Atmospheric environment (Oxford)
— id: 148743, year: 2012, vol: 47, page: 566, stat: Journal Article,

Distributed lag analyses of daily hospital admissions and source-apportioned fine particle air pollution
Lall, Ramona; Ito, Kazuhiko; Thurston, George D
2011 Apr;119(4):455-460, Environmental health perspectives
Background: Past time-series studies of the health effects of fine particulate matter [aerodynamic diameter </= 2.5 microm (PM2.5)] have used chemically nonspecific PM2.5 mass. However, PM2.5 is known to vary in chemical composition with source, and health impacts may vary accordingly.Objective: We tested the association between source-specific daily PM2.5 mass and hospital admissions in a time-series investigation that considered both single-lag and distributed-lag models.Methods: Daily PM2.5 speciation measurements collected in midtown Manhattan were analyzed via positive matrix factorization source apportionment. Daily and distributed-lag generalized linear models of Medicare respiratory and cardiovascular hospital admissions during 2001-2002 considered PM2.5 mass and PM2.5 from five sources: transported sulfate, residual oil, traffic, steel metal works, and soil.Results: Source-related PM2.5 (specifically steel and traffic) was significantly associated with hospital admissions but not with total PM2.5 mass. Steel metal works-related PM2.5 was associated with respiratory admissions for multiple-lag days, especially during the cleanup efforts at the World Trade Center. Traffic-related PM2.5 was consistently associated with same-day cardiovascular admissions across disease-specific subcategories. PM2.5 constituents associated with each source (e.g., elemental carbon with traffic) were likewise associated with admissions in a consistent manner. Mean effects of distributed-lag models were significantly greater than were maximum single-day effect models for both steel- and traffic-related PM2.5.Conclusions: Past analyses that have considered only PM2.5 mass or only maximum single-day lag effects have likely underestimated PM2.5 health effects by not considering source-specific and distributed-lag effects. Differing lag structures and disease specificity observed for steel-related versus traffic-related PM2.5 raise the possibility of distinct mechanistic pathways of health effects for particles of differing chemical composition
— id: 130293, year: 2011, vol: 119, page: 455, stat: Journal Article,

Personal Exposures to Traffic-Related Air Pollution and Acute Respiratory Health Among Bronx School Children with Asthma
Spira-Cohen A; Chen LC; Kendall M; Lall R; Thurston GD
2011 Apr;119(4):559-565, Environmental health perspectives
Background: Previous studies have reported relationships between adverse respiratory health outcomes and residential proximity to traffic pollution, but have not previously shown this at a personal exposure level. Objective: To compare, among inner-city children with asthma, the associations of adverse asthma outcome incidences with increased personal exposure to fine particle (PM2.5) mass air pollution vs. with the diesel-related carbonaceous fraction of PM2.5. Methods: Daily 24-hr personal samples of PM2.5, including the elemental carbon (EC) fraction, were collected for forty fifth-grade children with asthma at four South Bronx schools (10 children per school) during approximately one month each. Spirometry and symptom scores were recorded several times daily during weekdays. Results: Significantly elevated same-day relative risks of cough (1.23 (95% CI -1.0, 1.545), wheeze 1.45 (95% CI 1.03, 10.4), shortness of breath 1.41 (95% CI 1.0, 1.99%) and total symptoms 1.30 (95% CI 4.0, 1.62) were found with an increase in personal EC, but not with personal PM2.5 mass. Increased risk of cough and total symptoms was found with increased one-day lag and two-day average school-site EC. No significant associations were found with school-site PM2.5 mass or sulfur. The EC effect estimate was robust to addition of gaseous pollutants. Conclusion: Adverse health associations were strongest with personal measures of EC exposure, suggesting that the diesel 'soot' fraction of PM2.5 is most responsible for pollution-related asthma exacerbations among children living proximal to roadways. Studies that rely on exposure to particulate mass may underestimate PM health impacts
— id: 121313, year: 2011, vol: 119, page: 559, stat: Journal Article,

A source apportionment of U.S. fine particulate matter air pollution
Thurston G.D.; Ito K.; Lall R.
2011 ;45(24):3924-3936, Atmospheric environment (Oxford)
Using daily fine particulate matter (PM<sub>2.5</sub>) composition data from the 2000-2005 U.S. EPA Chemical Speciation Network (CSN) for over 200 sites, we applied multivariate methods to identify and quantify the major fine particulate matter (PM<sub>2.5</sub>) source components in the U.S. Novel aspects of this work were: (1) the application of factor analysis (FA) to multi-city daily data, drawing upon both spatial and temporal variations of chemical species; and, (2) the exclusion of secondary components (sulfates, nitrates and organic carbon) from the source identification FA to more clearly discern and apportion the PM<sub>2.5</sub> mass to primary emission source categories. For the quantification of source-related mass, we considered two approaches based upon the FA results: 1) using single key tracers for sources identified by FA in a mass regression; and, 2) applying Absolute Principal Component Analysis (APCA). In each case, we followed a two-stage mass regression approach, in which secondary components were first apportioned among the identified sources, and then mass was apportioned to the sources and to other secondary mass not explained by the individual sources. The major U.S. PM<sub>2.5</sub> source categories identified via FA (and their key tracers) were: Metals Industry (Pb, Zn); Crustal/Soil Particles (Ca, Si); Motor Vehicle Traffic (EC, NO<sub>2</sub>); Steel Industry (Fe, Mn); Coal Combustion (As, Se); Oil Combustion (V, Ni); Salt Particles (Na, Cl) and Biomass Burning (K). Nationwide spatial plots of the source-related PM<sub>2.5</sub> impacts were confirmatory of the factor interpretations: ubiquitous sources, such as Traffic and Soil, were found to be spread across the nation, more unique sources (such as Steel and Metals Processing) being highest in select industrialized cities, Biomass Burning was highest in the U.S. Northwest, while Residual Oil combustion was highest in cities in the Northeastern U.S. and in cities with major seaports. The sum of these source contributions and the secondary PM<sub>2.5</sub> components agreed well with the U.S. PM<sub>2.5</sub> observed during the study period (mean = 14.3 mug m<sup>-3</sup>; R<sup>2</sup> = 0.94). Apportionment regression analyses using single-element tracers for each source category gave results consistent with the APCA estimates. Comparisons of nearby sites indicated that the PM<sub>2.5</sub> mass and the secondary aerosols were most homogenous spatially, while traffic PM<sub>2.5</sub> and its tracer, EC, were among the most spatially representative of the source-related components. Comparison of apportionment results to a previous analysis of the 1979-1982 IP Network revealed similar and correlated major U.S. source category factors, albeit at lower levels than in the earlier period, suggesting a consistency in the U.S. spatial patterns of these source-related exposures over time, as well. These results indicate that applying source-apportionment methods to the nationwide CSN can be an informative avenue for identifying and quantifying source components for the subsequent estimation of source-specific health effects, potentially contributing to more efficient regulation of PM<sub>2.5</sub>. 2011 Elsevier Ltd
— id: 134929, year: 2011, vol: 45, page: 3924, stat: Journal Article,

Time-series analysis of mortality effects of fine particulate matter components in Detroit and Seattle
Zhou, Jiang; Ito, Kazuhiko; Lall, Ramona; Lippmann, Morton; Thurston, George
2011 Apr;119(4):461-466, Environmental health perspectives
BACKGROUND: Recent toxicological and epidemiological studies have shown associations between particulate matter (PM) and adverse health effects, but which PM components are most influential is less well known. OBJECTIVES: In this study, we used time-series analyses to determine the associations between daily fine PM [PM </= 2.5 microm in aerodynamic diameter (PM2.5)] concentrations and daily mortality in two U.S. cities-Seattle, Washington, and Detroit, Michigan. METHODS: We obtained daily PM2.5 filters for the years of 2002-2004 and analyzed trace elements using X-ray fluorescence and black carbon using light reflectance as a surrogate measure of elemental carbon. We used Poisson regression and distributed lag models to estimate excess deaths for all causes and for cardiovascular and respiratory diseases adjusting for time-varying covariates. We computed the excess risks for interquartile range increases of each pollutant at lags of 0 through 3 days for both warm and cold seasons. RESULTS: The cardiovascular and respiratory mortality series exhibited different source and seasonal patterns in each city. The PM2.5 components and gaseous pollutants associated with mortality in Detroit were most associated with warm season secondary aerosols and traffic markers. In Seattle, the component species most closely associated with mortality included those for cold season traffic and other combustion sources, such as residual oil and wood burning. CONCLUSIONS: The effects of PM2.5 on daily mortality vary with source, season, and locale, consistent with the hypothesis that PM composition has an appreciable influence on the health effects attributable to PM
— id: 138318, year: 2011, vol: 119, page: 461, stat: Journal Article,

Alteration of cardiac function in ApoE-/- mice by subchronic urban and regional inhalation exposure to concentrated ambient PM 2.5
Chen, Lung-Chi; Hwang, Jing-Shiang; Lall, Ramona; Thurston, George; Lippmann, Morton
2010 Jun;22(7):580-592, Inhalation toxicology
Ambient PM(2.5) (particulate matter with an aerodynamic diameters of less than 2.5 mum) is associated with alterations in the autonomic nervous system and cardiac function, but there are significant response variations. The authors simultaneously studied the effects of concentrated PM(2.5) (CAPs) in Sterling Forest (SF; dominated by long-range transported PM) and at the Mount Sinai School of Medicine (MS; rich in Ni and elemental/organic carbon [EC/OC]) in Manhattan, NY. ApoE(-/-) mice (n = 8/group) were exposed to filtered air or CAPs (average 133 and 123 microg/m(3) in SF and MS, respectively) for 6 h/day, 5 days/week for 6 months. Electrocardiogram (ECG) tracings were monitored using telemetry. At MS, current day CAPs mass was negatively associated with short-term changes in heart rate (HR), and positively with HR variability (HRV). At SF, CAPs mass was positively associated with HR, and negatively with HRV. At MS, HR and HRV changes were associated with PM(2.5) components associated with residual oil combustion > long-range transport > traffic > FeMn > incineration > soil, and fireworks had no associations. At SF, HR and HRV were associated with long-range transport > Ni refinery > soil > residual oil combustion/traffic. At both sites, there were cardiac function associations with PM(2.5), but not EC. At MS, there were associations with Ni and P, whereas at SF, they were with a mixture of long-range transported PM, crustal material, and combustion products. Thus subchronic CAPs exposures at locations with different particle compositions produced different effects on cardiac function in ApoE(-/-) mice
— id: 109793, year: 2010, vol: 22, page: 580, stat: Journal Article,

Fine particulate matter constituents associated with cardiovascular hospitalizations and mortality in new york city
Ito, Kazuhiko; Mathes, Robert; Ross, Zev; Nadas, Arthur; Thurston, George; Matte, Thomas
2010 Dec 17;119(4):467-473, Environmental health perspectives
Background: Recent time-series studies have indicated that both cardiovascular disease (CVD)mortality and hospitalizations are associated with particulate matter (PM). However, seasonal patterns of PM associations with these outcomes are not consistent, and PM components responsible for these associations have not been determined. We investigated this issue in New York City (NYC), where PM originates from regional and local combustion sources.Objective: In this study, we examined the role of particulate matter with aerodynamic diameter </= 2.5 microm (PM2.5) and its key chemical components on both CVD hospitalizations and on mortality in NYC.Methods: We analyzed daily deaths and emergency hospitalizations for CVDs among persons >/= 40 years of age for associations with PM2.5, its chemical components, nitrogen dioxide (NO2), carbon monoxide, and sulfur dioxide for the years 2000-2006 using a Poisson time-series model adjusting for temporal and seasonal trends, temperature effects, and day of the week. We estimated excess risks per interquartile-range increases at lags 0 through 3 days for warm (April through September) and cold (October through March) seasons.Results: The CVD mortality series exhibit strong seasonal trends, whereas the CVD hospitalization series show a strong day-of-week pattern. These outcome series were not correlated with each other but were individually associated with a number of PM2.5 chemical components from regional and local sources, each with different seasonal patterns and lags. Coal-combustion-related components (e.g., selenium) were associated with CVD mortality in summer and CVD hospitalizations in winter, whereas elemental carbon and NO2 showed associations with these outcomes in both seasons.Conclusion: Local combustion sources, including traffic and residual oil burning, may play a year-round role in the associations between air pollution and CVD outcomes, but transported aerosols may explain the seasonal variation in associations shown by PM2.5 mass
— id: 130310, year: 2010, vol: 119, page: 467, stat: Journal Article,

Personal exposures to traffic-related particle pollution among children with asthma in the South Bronx, NY
Spira-Cohen, Ariel; Chen, Lung Chi; Kendall, Michaela; Sheesley, Rebecca; Thurston, George D
2010 Jul;20(5):446-456, Journal of exposure science & environmental epidemiology
Personal exposures to fine particulate matter air pollution (PM(2.5)), and to its traffic-related fraction, were investigated in a group of urban children with asthma. The relationships of personal and outdoor school-site measurements of PM(2.5) and elemental carbon (EC) were characterized for a total of 40 fifth-grade children. These students, from four South Bronx, NY schools, each carried air pollution monitoring equipment with them for 24 h per day for approximately 1 month. Daily EC concentrations were estimated using locally calibrated reflectance of the PM(2.5) samples. Personal EC concentration was more closely related to outdoor school-site EC (median subject-specific: r=0.64) than was personal PM(2.5) to school-site PM(2.5) concentration (median subject-specific: r=0.33). Regression models also showed a stronger, more robust association of school site with personal measurements for EC than those for PM(2.5). High traffic pollution exposure was found to coincide with the weekday early morning rush hour, with higher personal exposures for participants living closer to a highway (<500 ft). A significant linear relationship of home distance from a highway with personal EC pollution exposure was also found (up to 1000 ft). This supports the assumptions by previous epidemiological studies using distance from a highway as an index of traffic PM exposure. These results are also consistent with the assumption that traffic, and especially smoke emitted from diesel vehicles, is a significant contributor to personal PM exposure levels in children living in urban areas such as the South Bronx, NY
— id: 110069, year: 2010, vol: 20, page: 446, stat: Journal Article,

The Temporal Association Between Air Pollution and Asthma Syndromic Illness Counts in New York City Is Modified by Neighborhood Traffic Density
Ito, K; Ross, Z; Metzger, K; Thurston, G; Martle, T
2009 NOV ;20(6):S188-S188, Epidemiology
— id: 106450, year: 2009, vol: 20, page: S188, stat: Journal Article,

Long-term ozone exposure and mortality
Jerrett, Michael; Burnett, Richard T; Pope, C Arden 3rd; Ito, Kazuhiko; Thurston, George; Krewski, Daniel; Shi, Yuanli; Calle, Eugenia; Thun, Michael
2009 Mar 12;360(11):1085-1095, New England journal of medicine
BACKGROUND: Although many studies have linked elevations in tropospheric ozone to adverse health outcomes, the effect of long-term exposure to ozone on air pollution-related mortality remains uncertain. We examined the potential contribution of exposure to ozone to the risk of death from cardiopulmonary causes and specifically to death from respiratory causes. METHODS: Data from the study cohort of the American Cancer Society Cancer Prevention Study II were correlated with air-pollution data from 96 metropolitan statistical areas in the United States. Data were analyzed from 448,850 subjects, with 118,777 deaths in an 18-year follow-up period. Data on daily maximum ozone concentrations were obtained from April 1 to September 30 for the years 1977 through 2000. Data on concentrations of fine particulate matter (particles that are < or = 2.5 microm in aerodynamic diameter [PM(2.5)]) were obtained for the years 1999 and 2000. Associations between ozone concentrations and the risk of death were evaluated with the use of standard and multilevel Cox regression models. RESULTS: In single-pollutant models, increased concentrations of either PM(2.5) or ozone were significantly associated with an increased risk of death from cardiopulmonary causes. In two-pollutant models, PM(2.5) was associated with the risk of death from cardiovascular causes, whereas ozone was associated with the risk of death from respiratory causes. The estimated relative risk of death from respiratory causes that was associated with an increment in ozone concentration of 10 ppb was 1.040 (95% confidence interval, 1.010 to 1.067). The association of ozone with the risk of death from respiratory causes was insensitive to adjustment for confounders and to the type of statistical model used. CONCLUSIONS: In this large study, we were not able to detect an effect of ozone on the risk of death from cardiovascular causes when the concentration of PM(2.5) was taken into account. We did, however, demonstrate a significant increase in the risk of death from respiratory causes in association with an increase in ozone concentration
— id: 135232, year: 2009, vol: 360, page: 1085, stat: Journal Article,

Ambient air pollution and brain cancer mortality
McKean-Cowdin, Roberta; Calle, Eugenia E; Peters, John M; Henley, Jane; Hannan, Lindsay; Thurston, George D; Thun, Michael J; Preston-Martin, Susan
2009 Nov;20(9):1645-1651, Cancer causes & control. ccc
OBJECTIVE: Growing evidence that ultrafine particles in ambient air can cause brain lesions in animals led us to investigate whether particulate components of air pollution may be associated with brain cancer risk in humans. Air pollution has been associated with respiratory disorders and cardiovascular morbidity and mortality, but associations between air pollutants and brain cancer have not been investigated in adults. METHODS: The analyses included 1,284 deaths due to brain cancer from the Cancer Prevention Study-II, an ongoing prospective mortality study of adults in the United States and Puerto Rico conducted by the American Cancer Society. Air pollution data from national databases for metropolitan areas were combined with residential history and vital status data to estimate exposure to particulate and gaseous air pollution. RESULTS: We found no elevated risk for estimated measures of air pollutants, an unanticipated reduction in risk was found between gaseous air pollutants and brain cancer mortality. CONCLUSION: The findings do not provide evidence of increased risk of brain cancer mortality due to air pollutants
— id: 138040, year: 2009, vol: 20, page: 1645, stat: Journal Article,

Health and Climate Change 5 Public health benefits of strategies to reduce greenhouse-gas emissions: health implications of short-lived greenhouse pollutants
Smith, KR; Jerrett, M; Anderson, HR; Burnett, RT; Stone, V; Derwent, R; Atkinson, RW; Cohen, A; Shonkoff, SB; Krewski, D; Pope, CA; Thun, MJ; Thurston, G
2009 DEC-JAN ;374(9707):2091-2103, Lancet
In this report we review the health effects of three short-lived greenhouse pollutants-black carbon, ozone, and sulphates. We under-took new meta-analyses of existing time-series studies and an analysis of a cohort of 352000 people in 66 US cities during 18 years of follow-up. This cohort study provides estimates of mortality effects from long-term exposure to elemental carbon, an indicator of black carbon mass, and evidence that ozone exerts an independent risk of mortality. Associations among these pollutants make drawing conclusions about their individual health effects difficult at present, but sulphate seems to have the most robust effects in multiple-pollutant models. Generally, the toxicology of the pure compounds and their epidemiology diverge because atmospheric black carbon, ozone, and sulphate are associated and could interact with related toxic species. Although sulphate is a cooling agent, black carbon and ozone could together exert nearly half as much global warming as carbon dioxide. The complexity of these health and climate effects needs to be recognised in mitigation policies
— id: 106068, year: 2009, vol: 374, page: 2091, stat: Journal Article,

Ischemic Heart Disease Mortality Associations with Long-Term Exposure to PM2.5 Components
Thurston, G; Burnett, R; Krewski, D; Shi, YL; Turner, M; Ito, K; Lall, R; Jerrett, M; Calle, E; Tunne, M; Pope, CA
2009 NOV ;20(6):S80-S81, Epidemiology
— id: 106446, year: 2009, vol: 20, page: S80, stat: Journal Article,

Use of health information in air pollution health research: past successes and emerging needs
Thurston, George D; Bekkedal, Marni Y V; Roberts, Eric M; Ito, Kazuhiko; Pope, C Arden 3rd; Glenn, Barbara S; Ozkaynak, Haluk; Utell, Mark J
2009 Jan;19(1):45-58, Journal of exposure science & environmental epidemiology
In September 2006, the US Environmental Protection Agency and the US Centers for Disease Control (CDC) co-organized a symposium on 'Air Pollution Exposure and Health.' The main objective of this symposium was to identify opportunities for improving the use of exposure and health information in future studies of air pollution health effects. This paper deals with the health information needs of such studies. We begin with a selected review of different types of health data and how they were used in previous epidemiologic studies of health effects of ambient particulate matter (PM). We then examine the current and emerging information needs of the environmental health community, dealing with PM and other air pollutants of health concern. We conclude that the past use of routinely collected health data proved to be essential for activities to protect public health, including the identification and evaluation of health hazards by air pollution research, setting standards for criteria pollutants, surveillance of health outcomes to identify incidence trends, and the more recent CDC environmental public health tracking program. Unfortunately, access to vital statistics records that have informed such pivotal research has recently been curtailed sharply, threatening the continuation of the type of research necessary to support future standard setting and research on emerging exposure and health problems (e.g. asthma, multiple sclerosis, diabetes, and others), as well as our ability to evaluate the efficacy of regulatory and other prevention activities. A comprehensive devoted effort, perhaps new legislation, will be needed to address the standardization, centralization, and sharing of data sets, as well as to harmonize the interpretation of confidentiality and privacy protections across jurisdictions. These actions, combined with assuring researchers and public health practitioners appropriate access to data for evaluation of environmental risks, will be essential for the achievement of our environmental health protection goals
— id: 93217, year: 2009, vol: 19, page: 45, stat: Journal Article,

Ambient particulates alter vascular function through induction of reactive oxygen and nitrogen species
Ying, Zhekang; Kampfrath, Thomas; Thurston, George; Farrar, Britten; Lippmann, Mort; Wang, Aixia; Sun, Qinghua; Chen, Lung Chi; Rajagopalan, Sanjay
2009 Sep;111(1):80-88, Toxicological sciences
Previous studies have shown a link between inhaled particulate matter (PM) exposure in urban areas and susceptibility to cardiovascular diseases. Although an oxidative stress pathway is strongly implicated, the locus of generation of reactive oxygen species (ROS) and the mechanisms by which these radicals exert their effects remain to be characterized. To test the hypothesis that exposure to environmentally relevant inhaled concentrated ambient PM (CAPs) enhances atherosclerosis through induction of vascular ROS and reactive nitrogen species. High-fat chow fed apolipoprotein E(-/-) mice were exposed to CAPs of less than 2.5 microm (PM(2.5)) or filtered air (FA), for 6 h/day, 5 days/week, for 4 months in Manhattan, NY. Atherosclerotic lesions were analyzed by histomorphometricly. Vascular reactivity, superoxide generation, mRNA expression of NADPH (nicotinamide adenine dinucleotide phosphate, reduced) oxidase subunits, inducible nitric oxide synthase, endothelial nitric oxide synthase, and GTP cyclohydrolase I were also assessed. Manhattan PM(2.5) CAPs were characterized by higher concentrations of organic and elemental carbon. Analysis of vascular responses revealed significantly decreased phenylephrine constriction in CAPs-exposed mice, which was restored by a soluble guanine cyclase inhibitor 1H-[1,2,4]oxadiazole[4,3-a]quinoxalin-1-one. Vascular relaxation to A23187, but not to acetylcholine, was attenuated in CAPs mice. Aortic expression of NADPH oxidase subunits (p47(phox) and rac1) and iNOS were markedly increased, paralleled by increases in superoxide generation and extensive protein nitration in the aorta. The composite plaque area of thoracic aorta was significantly increased with pronounced macrophage infiltration and lipid deposition in the CAPs mice. CAPs exposure in Manhattan alters vasomotor tone and enhances atherosclerosis through NADPH oxidase dependent pathways
— id: 114538, year: 2009, vol: 111, page: 80, stat: Journal Article,

Ancillary human health benefits of improved air quality resulting from climate change mitigation
Bell, Michelle L; Davis, Devra L; Cifuentes, Luis A; Krupnick, Alan J; Morgenstern, Richard D; Thurston, George D
2008 ;7:41-41, Environmental health
BACKGROUND: Greenhouse gas (GHG) mitigation policies can provide ancillary benefits in terms of short-term improvements in air quality and associated health benefits. Several studies have analyzed the ancillary impacts of GHG policies for a variety of locations, pollutants, and policies. In this paper we review the existing evidence on ancillary health benefits relating to air pollution from various GHG strategies and provide a framework for such analysis. METHODS: We evaluate techniques used in different stages of such research for estimation of: (1) changes in air pollutant concentrations; (2) avoided adverse health endpoints; and (3) economic valuation of health consequences. The limitations and merits of various methods are examined. Finally, we conclude with recommendations for ancillary benefits analysis and related research gaps in the relevant disciplines. RESULTS: We found that to date most assessments have focused their analysis more heavily on one aspect of the framework (e.g., economic analysis). While a wide range of methods was applied to various policies and regions, results from multiple studies provide strong evidence that the short-term public health and economic benefits of ancillary benefits related to GHG mitigation strategies are substantial. Further, results of these analyses are likely to be underestimates because there are a number of important unquantified health and economic endpoints. CONCLUSION: Remaining challenges include integrating the understanding of the relative toxicity of particulate matter by components or sources, developing better estimates of public health and environmental impacts on selected sub-populations, and devising new methods for evaluating heretofore unquantified and non-monetized benefits
— id: 96452, year: 2008, vol: 7, page: 41, stat: Journal Article,

Diesel Air Pollution and Asthma Exacerbations in a Group of Children with Asthma
Spira-Cohen, A; Chen, L; Kendall, M; Xillari, D; Clemente, J; Blaustein, M; Gorzcynski, J; Thurston, GD
2008 NOV ;19(6):S339-S339, Epidemiology
— id: 98113, year: 2008, vol: 19, page: S339, stat: Journal Article,

Air pollution and health: indoor air pollution in the developing world is the real key to reducing the burden of ill health - Reply
Thurston, GD
2008 MAR ;63(3):288-288, Thorax
— id: 87121, year: 2008, vol: 63, page: 288, stat: Journal Article,

Characterization of PM2.5, gaseous pollutants, and meteorological interactions in the context of time-series health effects models
Ito, Kazuhiko; Thurston, George D; Silverman, Robert A
2007 Dec;17 Suppl 2:S45-S60, Journal of exposure science & environmental epidemiology
Associations of particulate matter (PM) and ozone with morbidity and mortality have been reported in many recent observational epidemiology studies. These studies often considered other gaseous co-pollutants also as potential confounders, including nitrogen dioxide (NO2), sulfur dioxide (SO2), and carbon monoxide (CO). However, because each of these air pollutants can have different seasonal patterns and chemical interactions, the estimation and interpretation of each pollutant's individual risk estimates may not be straightforward. Multi-collinearity among the air pollution and weather variables also leaves the possibility of confounding and over- or under-fitting of meteorological variables, thereby potentially influencing the health effect estimates for the various pollutants in differing ways. To investigate these issues, we examined the temporal relationships among air pollution and weather variables in the context of air pollution health effects models. We compiled daily data for PM less than 2.5 mum (PM2.5), ozone, NO2, SO2, CO, temperature, dew point, relative humidity, wind speed, and barometric pressure for New York City for the years 1999-2002. We conducted several sets of analyses to characterize air pollution and weather data interactions, to assess different aspects of these data issues: (1) spatial/temporal variation of PM2.5 and gaseous pollutants measured at multiple monitors; (2) temporal relationships among air pollution and weather variables; and (3) extent and nature of multi-collinearity of air pollution and weather variables in the context of health effects models. The air pollution variables showed a varying extent of intercorrelations with each other and with weather variables, and these correlations also varied across seasons. For example, NO2 exhibited the strongest negative correlation with wind speed among the pollutants considered, while ozone's correlation with PM2.5 changed signs across the seasons (positive in summer and negative in winter). The extent of multi-collinearity problems also varied across pollutants and choice of health effects models commonly used in the literature. These results indicate that the health effects regression need to be run by season for some pollutants to provide the most meaningful results. We also find that model choice and interpretation needs to take into consideration the varying pollutant concurvities with the model co-variables in each pollutant's health effects model specification. Finally, we provide an example for analysis of associations between these air pollutants and asthma emergency department visits in New York City, which evaluate the relationship between the various pollutants' risk estimates and their respective concurvities, and discuss the limitations that these results imply about the interpretability of multi-pollutant health effects models
— id: 78017, year: 2007, vol: 17 Suppl 2, page: S45, stat: Journal Article,

Panel discussion review: session two--interpretation of observed associations between multiple ambient air pollutants and health effects in epidemiologic analyses
Kim, Jee Young; Burnett, Richard T; Neas, Lucas; Thurston, George D; Schwartz, Joel; Tolbert, Paige E; Brunekreef, Bert; Goldberg, Mark S; Romieu, Isabelle
2007 Dec;17 Suppl 2:S83-S89, Journal of exposure science & environmental epidemiology
Air pollution epidemiologic research has often utilized ambient air concentrations measured from centrally located monitors as a surrogate measure of exposure to these pollutants. Associations between these ambient concentrations and health outcomes such as lung function, hospital admissions, and mortality have been examined in short- and long-term cohort studies as well as in time-series and case-crossover studies. The issues related to interpreting the observed associations of ambient air pollutants with health outcomes were discussed at the US EPA sponsored workshop on December 13 and 14, 2006 in Chapel Hill, North Carolina, USA. The second session of this workshop focused on the following topics: (1) statistical methodology and study designs that may improve understanding of multipollutant health effects; (2) ambient concentrations as surrogate measures of pollutant mixtures; and (3) source-focused epidemiologic research. New methodology and approaches to better distinguish the effects of individual pollutants include multicity hierarchical modeling and the use of case-crossover analysis to control for copollutants. An alternative approach is to examine the mixture as a whole using principal component analysis. Another important consideration is to what extent the observed health associations are attributable to individual pollutants, which are often from common sources and are correlated, versus the pollutant mixtures that the pollutants are representing. For example, several ambient air concentrations, such as particulate matter mass, nitrogen dioxide, and carbon monoxide, may be serving as surrogate measures of motor vehicle exhaust. Source apportionment analysis is one method that may allow further advancement in understanding the source components that contribute to multipollutant health effects
— id: 96453, year: 2007, vol: 17 Suppl 2, page: S83, stat: Journal Article,

A land use regression for predicting fine particulate matter concentrations in the New York City region
Ross, Z; Jerrett, M; Ito, K; Tempalski, B; Thurston, GD
2007 APR ;41(11):2255-2269, Atmospheric environment (Oxford)
We developed regression equations to predict fine particulate matter (PM2.5) at air monitoring locations in the New York City region using data on nearby traffic and land use patterns. Three-year averages (1999-2001) Of PM2.5 at US Environmental Protection Agency (EPA) monitors in the 28 counties including and surrounding New York City were calculated using daily data front the EPA's Air Quality Subsystem. As the secondary contribution to PM2.5 concentrations is lowest in the winter, we also calculated and modeled average winter 2000 PM2.5 to conduct a preliminary evaluation of model sensitivity to source contribution. Candidate predictor variables included traffic, land use, census and emissions data from local, state and national sources and were tabulated for a series of circular buffer regions at varying distances around the monitors using a geographic information system. In total, more than 25 variables at 5 different buffer distances were considered for inclusion in the model. Before evaluating the variables we removed several samples from the modeling for validation. For comparison and validation purposes we computed both a model using data for the full 28-county region as well as a more urbanized 9-county region. We found that traffic within a buffer of 300 or 500 m, explains the greatest proportion of variance (37-44%) in all 3 models. Measures of urbanization, specifically population density, explain a significant amount of the residual variation (7-18%) after including a traffic variable. Finally, a measure of industrial land use further improves the 28-county and 9-county models based on the 3-yr annual averages, explaining an additional 4% and 11% of the variation, respectively, while vegetative land use improves the winter model explaining an additional 6%. The final models predicted well at validation locations. In total, the final land use regression models explain between 61% and 64% of the variation in PM2.5. (c) 2006 Elsevier Ltd. All rights reserved
— id: 71624, year: 2007, vol: 41, page: 2255, stat: Journal Article,

Applying attributable risk methods to identify susceptible subpopulations
Thurston, G
2007 SEP ;18(5):S191-S191, Epidemiology
— id: 74337, year: 2007, vol: 18, page: S191, stat: Journal Article,

Air pollution, human health, climate change and you
Thurston, George
2007 Sep;62(9):748-749, Thorax
— id: 74210, year: 2007, vol: 62, page: 748, stat: Journal Article,

Air pollution : outdoor and indoor sources
Thurston, George D
Environmental and occupational medicine Philadelphia : Wolters Kluwer/Lippincott Williams & Wilkins, 2007,
— id: 5375, year: 2007, vol: , page: ?, stat: Chapter,

Is airborne acid an important cause of health effects?
Chen LC; Thurston GD; Schlesinger RB
Air pollution and health London : Imperial College Press, 2006,
— id: 4291, year: 2006, vol: , page: ?, stat: Chapter,

PM source apportionment and health effects: 1. Intercomparison of source apportionment results
Hopke, Philip K; Ito, Kazuhiko; Mar, Therese; Christensen, William F; Eatough, Delbert J; Henry, Ronald C; Kim, Eugene; Laden, Francine; Lall, Ramona; Larson, Timothy V; Liu, Hao; Neas, Lucas; Pinto, Joseph; Stolzel, Matthias; Suh, Helen; Paatero, Pentti; Thurston, George D
2006 May;16(3):275-286, Journal of exposure science & environmental epidemiology
During the past three decades, receptor models have been used to identify and apportion ambient concentrations to sources. A number of groups are employing these methods to provide input into air quality management planning. A workshop has explored the use of resolved source contributions in health effects models. Multiple groups have analyzed particulate composition data sets from Washington, DC and Phoenix, AZ. Similar source profiles were extracted from these data sets by the investigators using different factor analysis methods. There was good agreement among the major resolved source types. Crustal (soil), sulfate, oil, and salt were the sources that were most unambiguously identified (generally highest correlation across the sites). Traffic and vegetative burning showed considerable variability among the results with variability in the ability of the methods to partition the motor vehicle contributions between gasoline and diesel vehicles. However, if the total motor vehicle contributions are estimated, good correspondence was obtained among the results. The source impacts were especially similar across various analyses for the larger mass contributors (e.g., in Washington, secondary sulfate SE=7% and 11% for traffic; in Phoenix, secondary sulfate SE=17% and 7% for traffic). Especially important for time-series health effects assessment, the source-specific impacts were found to be highly correlated across analysis methods/researchers for the major components (e.g., mean analysis to analysis correlation, r>0.9 for traffic and secondary sulfates in Phoenix and for traffic and secondary nitrates in Washington. The sulfate mean r value is >0.75 in Washington.). Overall, although these intercomparisons suggest areas where further research is needed (e.g., better division of traffic emissions between diesel and gasoline vehicles), they provide support the contention that PM(2.5) mass source apportionment results are consistent across users and methods, and that today's source apportionment methods are robust enough for application to PM(2.5) health effects assessments
— id: 72115, year: 2006, vol: 16, page: 275, stat: Journal Article,

PM source apportionment and health effects: 2. An investigation of intermethod variability in associations between source-apportioned fine particle mass and daily mortality in Washington, DC
Ito, Kazuhiko; Christensen, William F; Eatough, Delbert J; Henry, Ronald C; Kim, Eugene; Laden, Francine; Lall, Ramona; Larson, Timothy V; Neas, Lucas; Hopke, Philip K; Thurston, George D
2006 Jul;16(4):300-310, Journal of exposure science & environmental epidemiology
Source apportionment may be useful in epidemiological investigation of PM health effects, but variations and options in these methods leave uncertainties. An EPA-sponsored workshop investigated source apportionment and health effects analyses by examining the associations between daily mortality and the investigators' estimated source-apportioned PM(2.5) for Washington, DC for 1988-1997. A Poisson Generalized Linear Model (GLM) was used to estimate source-specific relative risks at lags 0-4 days for total non-accidental, cardiovascular, and cardiorespiratory mortality adjusting for weather, seasonal/temporal trends, and day-of-week. Source-related effect estimates and their lagged association patterns were similar across investigators/methods. The varying lag structure of associations across source types, combined with the Wednesday/Saturday sampling frequency made it difficult to compare the source-specific effect sizes in a simple manner. The largest (and most significant) percent excess deaths per 5-95(th) percentile increment of apportioned PM(2.5) for total mortality was for secondary sulfate (variance-weighted mean percent excess mortality=6.7% (95% CI: 1.7, 11.7)), but with a peculiar lag structure (lag 3 day). Primary coal-related PM(2.5) (only three teams) was similarly significantly associated with total mortality with the same 3-day lag as sulfate. Risk estimates for traffic-related PM(2.5), while significant in some cases, were more variable. Soil-related PM showed smaller effect size estimates, but they were more consistently positive at multiple lags. The cardiovascular and cardiorespiratory mortality associations were generally similar to those for total mortality. Alternative weather models generally gave similar patterns, but sometimes affected the lag structure (e.g., for sulfate). Overall, the variations in relative risks across investigators/methods were found to be much smaller than those across estimated source types or across lag days for these data. This consistency suggests the robustness of the source apportionment in health effects analyses, but remaining issues, including accuracy of source apportionment and source-specific sensitivity to weather models, need to be investigated
— id: 72113, year: 2006, vol: 16, page: 300, stat: Journal Article,

Impact of local and transported PM2.5 on elderly hospital admissions in New York City
Lall, R; Ito, K; Thurston, G
2006 NOV ;17(6):S201-S201, Epidemiology
— id: 71047, year: 2006, vol: 17, page: S201, stat: Journal Article,

Identifying and quantifying transported vs. local sources of New York City PM2.5 fine particulate matter air pollution
Lall, R; Thurston, GD
2006 NOV ;40(7):S333-S346, Atmospheric environment (Oxford)
New York City (NYC) is presently in violation of the nation's PM2.5 annual mass standard, and will have to take actions to control the sources contributing to these violations. This paper seeks to differentiate the impact of long-range transported aerosols on the air quality of downtown NYC, so that the roles of local sources can more clearly be evaluated. Past source apportionment studies have considered single sites individually in their source apportionment analyses to identify and determine sources affecting that site, often finding secondary sulfates to be an important contributor, but not being able to quantify the portion that is transported vs. local. In this study, a rural site located in Sterling Forest, NY, which is near to the NYC area, but unaffected by local NYC sources, is instead used as a reference to separate the portion of the aerosol that is transported to our Manhattan, NYC site before conducting the source apportionment analysis. Sterling Forest is confirmed as a background site via elemental comparisons with NYC during regional transport episodes of Asian and Sahara sandstorm dusts, as well as by comparisons with a second background site in Chester, NJ. Two different approaches that incorporate Sterling Forest background data into the NYC source apportionment analysis are then applied to quantify local vs. transported aerosols. Six source categories are identified for N
— id: 69306, year: 2006, vol: 40, page: S333, stat: Journal Article,

Characterization of size-fractionated World Trade Center dust and estimation of relative dust concentration to ambient particulate concentrations
Maciejczyk P; Zeisler RL; Hwang JS; Thurston GD; Chen LC
2006 ;919:114-131, ACS symposium series
— id: 72670, year: 2006, vol: 919, page: 114, stat: Journal Article,

PM source apportionment and health effects. 3. Investigation of inter-method variations in associations between estimated source contributions of PM2.5 and daily mortality in Phoenix, AZ
Mar, Therese F; Ito, Kazuhiko; Koenig, Jane Q; Larson, Timothy V; Eatough, Delbert J; Henry, Ronald C; Kim, Eugene; Laden, Francine; Lall, Ramona; Neas, Lucas; Stolzel, Matthias; Paatero, Pentti; Hopke, Philip K; Thurston, George D
2006 Jul;16(4):311-320, Journal of exposure science & environmental epidemiology
As part of an EPA-sponsored workshop to investigate the use of source apportionment in health effects analyses, the associations between the participant's estimated source contributions of PM(2.5) for Phoenix, AZ for the period from 1995-1997 and cardiovascular and total nonaccidental mortality were analyzed using Poisson generalized linear models (GLM). The base model controlled for extreme temperatures, relative humidity, day of week, and time trends using natural spline smoothers. The same mortality model was applied to all of the apportionment results to provide a consistent comparison across source components and investigators/methods. Of the apportioned anthropogenic PM(2.5) source categories, secondary sulfate, traffic, and copper smelter-derived particles were most consistently associated with cardiovascular mortality. The sources with the largest cardiovascular mortality effect size were secondary sulfate (median estimate=16.0% per 5th-to-95th percentile increment at lag 0 day among eight investigators/methods) and traffic (median estimate=13.2% per 5th-to-95th percentile increment at lag 1 day among nine investigators/methods). For total mortality, the associations were weaker. Sea salt was also found to be associated with both total and cardiovascular mortality, but at 5 days lag. Fine particle soil and biomass burning factors were not associated with increased risks. Variations in the maximum effect lag varied by source category suggesting that past analyses considering only single lags of PM(2.5) may have underestimated health impact contributions at different lags. Further research is needed on the possibility that different PM(2.5) source components may have different effect lag structure. There was considerable consistency in the health effects results across source apportionments in their effect estimates and their lag structures. Variations in results across investigators/methods were small compared to the variations across source categories. These results indicate reproducibility of source apportionment results across investigative groups and support applicability of these methods to effects studies. However, future research will also need to investigate a number of other important issues including accuracy of results
— id: 72114, year: 2006, vol: 16, page: 311, stat: Journal Article,

Asthma hospital admissions and ambient air pollution concentrations in New York City
Restrepo, C; Simonoff, J; Thurston, G; Zimmerman, R
2006 NOV ;17(6):S266-S266, Epidemiology
— id: 71050, year: 2006, vol: 17, page: S266, stat: Journal Article,

A source apportionment of US fine particulate matter pollution for health effects analysis
Thurston, G; Lall, R
2006 NOV ;17(6):S271-S271, Epidemiology
— id: 71051, year: 2006, vol: 17, page: S271, stat: Journal Article,

Hospital admissions and fine particulate air pollution
Thurston, George D
2006 Oct 25;296(16):1966-1966, JAMA
— id: 72112, year: 2006, vol: 296, page: 1966, stat: Journal Article,

Monitor-to-monitor temporal correlation of air pollution in the contiguous US
Ito, Kazuhiko; De Leon, Samantha; Thurston, George D; Nadas, Arthur; Lippmann, Morton
2005 Mar;15(2):172-184, Journal of exposure analysis & environmental epidemiology
Numerous studies have reported short-term associations between ambient air pollution concentrations and mortality and morbidity. Particulate matter (PM) was often implicated as the most significant predictor of the health outcomes among the various air pollutants. However, a question remains as to the potential role played by the relative error of exposure estimation associated with each pollutant in defining their relative strengths of association. While most of the recent studies on PM exposure measurements have focused on the temporal correlation between personal exposures and the concentrations observed at ambient air quality monitors (within a few miles from the subjects), there have been few studies that systematically evaluated spatial uniformity of temporal correlation of air pollution within the scale of a city (several tens of miles) for which mortality or morbidity outcomes are aggregated in time-series studies. In this study, spatial uniformity of temporal correlation was examined by computing monitor-to-monitor correlation using available multiple monitors for PM(10) and gaseous criteria pollutants (NO(2), SO(2), CO, and O(3)) in the nationwide data between 1988 and 1997. For each monitor, the median of temporal correlation with other monitors within the Air Quality Control Region (AQCR) was computed. The resulting median monitor-to-monitor correlation was modeled as a function of qualitative site characteristics (i.e., land-use, location-setting, and monitoring-objective) and quantitative information (median separation distance, longitude/latitude or regional indicators) for each pollutant. Generalized additive models (GAM) were used to fit the smooth function of the separation distance and regional variation. The intercepts of the models across pollutants showed the overall rankings in monitor-to-monitor correlation on the average to be: O(3), NO(2), and PM(10), (r approximately 0.6 to 0.8)>CO (r<0.6)>SO(2) (r<0.5). Both the separation distance and regional variation were important predictors of the correlation. For PM(10), for example, the correlation for the monitors along the East Coast was higher by approximately 0.2 than western regions. The qualitative monitor characteristics were often significant predictors of the variation in correlation, but their impacts were not substantial in magnitude for most categories. These results suggest that the apparent regional heterogeneity in PM effect estimates, as well as the differences in the significance of health outcome associations across pollutants, may in part be contributed to by the differences in monitor-to-monitor correlations by region and across pollutants.Journal of Exposure Analysis and Environmental Epidemiology advance online publication, 16 June 2004; doi:10.1038/sj.jea.7500386
— id: 48192, year: 2005, vol: 15, page: 172, stat: Journal Article,

Mortality and long-term exposure to ambient air pollution: Ongoing analyses based on the American Cancer Society cohort
Krewski, D; Burnett, R; Jerrett, M; Pope, CA; Rainham, D; Calle, E; Thurston, G; Thun, M
2005 JUL 9 ;68(13-14):1093-1109, Journal of toxicology & environmental health. Pt. A
This article provides an overview of previous analysis and reanalysis of the American Cancer Society (ACS) cohort, along with an indication of current ongoing analyses of the cohort with additional follow-up information through to 2000. Results of the first analysis conducted by Pope et al. (1995) showed that higher average sulfate levels were associated with increased mortality, particularly from cardiopulmonary disease. A reanalysis of the ACS cohort, undertaken by Krewski et al. (2000), found the original risk estimates for fine-particle and sulfate air pollution to he highly robust against alternative statistical techniques and spatial modeling approaches. A detailed investigation of covariate effects found a significant modifying effect of education with risk of mortality associated with fine particles declining with increasing educational attainment. Pope et al. (2002) subsequently reported results of a subsequent study using an additional 10 yr of follow-up of the ACS cohort. This updated analysis included gaseous copollutant and new fine-particle measurements, more comprehensive information on occupational exposures, dietary variables, and the most recent developments in statistical modeling integrating random effects and nonparametric spatial smoothing into the Cox proportional hazards model. Robust associations between ambient fine particulate air pollution and elevated risks of cardiopulmonary and lung cancer mortality were clearly evident, providing the strongest evidence to date that long-term exposure to fine particles is an important health risk. Current ongoing analysis using the extended follow-up information will explore the role of ecologic, economic, and, demographic covariates in the particulate air pollution and mortality association. This analysis will also provide insight into the role of spatial autocorrelation at multiple geographic scales, and whether critical instances in time of exposure to fine particles influence the risk of mortality from cardiopulmonary and lung cancer. Information on the influence of covariates at multiple scales and of critical exposure time windows can assist policymakers in establishing timelines for regulatory interventions that maximize population health benefits
— id: 56311, year: 2005, vol: 68, page: 1093, stat: Journal Article,

Results and implications of the workshop on the source apportionment of PM health effects
Thurston, G; Ito, K; Mar, T; Christensen, WF; Eatough, DJ; Henry, RC; Kim, E; Laden, F; Lall, R; Larson, TV; Liu, H; Neas, L; Pinto, J; Stolzel, M; Suh, H; Hopke, PK
2005 SEP ;16(5):S134-S135, Epidemiology
— id: 58748, year: 2005, vol: 16, page: S134, stat: Journal Article,

Workgroup report: workshop on source apportionment of particulate matter health effects--intercomparison of results and implications
Thurston, George D; Ito, Kazuhiko; Mar, Therese; Christensen, William F; Eatough, Delbert J; Henry, Ronald C; Kim, Eugene; Laden, Francine; Lall, Ramona; Larson, Timothy V; Liu, Hao; Neas, Lucas; Pinto, Joseph; Stolzel, Matthias; Suh, Helen; Hopke, Philip K
2005 Dec;113(12):1768-1774, Environmental health perspectives
Although the association between exposure to ambient fine particulate matter with aerodynamic diameter < 2.5 microm (PM2.5) and human mortality is well established, the most responsible particle types/sources are not yet certain. In May 2003, the U.S. Environmental Protection Agency's Particulate Matter Centers Program sponsored the Workshop on the Source Apportionment of PM Health Effects. The goal was to evaluate the consistency of the various source apportionment methods in assessing source contributions to daily PM2.5 mass-mortality associations. Seven research institutions, using varying methods, participated in the estimation of source apportionments of PM2.5 mass samples collected in Washington, DC, and Phoenix, Arizona, USA. Apportionments were evaluated for their respective associations with mortality using Poisson regressions, allowing a comparative assessment of the extent to which variations in the apportionments contributed to variability in the source-specific mortality results. The various research groups generally identified the same major source types, each with similar elemental makeups. Intergroup correlation analyses indicated that soil-, sulfate-, residual oil-, and salt-associated mass were most unambiguously identified by various methods, whereas vegetative burning and traffic were less consistent. Aggregate source-specific mortality relative risk (RR) estimate confidence intervals overlapped each other, but the sulfate-related PM2.5 component was most consistently significant across analyses in these cities. Analyses indicated that source types were a significant predictor of RR, whereas apportionment group differences were not. Variations in the source apportionments added only some 15% to the mortality regression uncertainties. These results provide supportive evidence that existing PM2.5 source apportionment methods can be used to derive reliable insights into the source components that contribute to PM2.5 health effects
— id: 66456, year: 2005, vol: 113, page: 1768, stat: Journal Article,

The role of air pollution in asthma and other pediatric morbidities
Trasande, Leonardo; Thurston, George D
2005 Apr;115(4):689-699, Journal of allergy & clinical immunology
A growing body of research supports the role of outdoor air pollutants in acutely aggravating chronic diseases in children, and suggests that the pollutants may have a role in the development of these diseases. This article reviews the biologic basis of children's unique vulnerability to highly prevalent outdoor air pollutants, with a special focus on ozone, respirable particulate matter (PM 2.5 [<2.5 microm in diameter] and PM 10 [<10 microm in diameter]), lead, sulfur dioxide, carbon monoxide, and nitrogen oxides. We also summarize understanding regarding health effects and molecular mechanisms of action. Practitioners can significantly reduce morbidity in children and other vulnerable populations by advising families to minimize pollutant exposures to children with asthma, or at a broader level by educating policymakers about the need to act to reduce pollutant emissions. Management of children with asthma must expand beyond preventing exposures to agents that directly cause allergic reactions (and therefore can be diagnosed by means of skin tests) and must focus more attention on agents that cause a broad spectrum of nonspecific, generalized inflammation, such as air pollution
— id: 72116, year: 2005, vol: 115, page: 689, stat: Journal Article,

Spatial variation of PM2.5 chemical species and source-apportioned mass concentrations in New York City
Ito, K; Xue, N; Thurston, G
2004 OCT ;38(31):5269-5282, Atmospheric environment (Oxford)
Particulate matter (PM) is a chemically non-specific pollutant, and may originate or be derived from different emission source types. Thus, its toxicity may well vary depending on its chemical composition. If the PM toxicity could be determined based on source types, the regulation of PM may be implemented more effectively. A large number of monitors began collecting PM less than 2.5 mum in diameter (PM2.5) mass samples for subsequent chemical speciation starting 2000-2001 in the US. The data from this chemical speciation network can be useful for source-oriented evaluations of PM health effects. However, there are several issues that need to be considered in the analysis and interpretation of these data. One major issue is a monitor's representation of regional, sub-regional, and local air pollution exposures to the population in a city or metropolitan area. Because health outcomes in time-series air pollution epidemiological studies are aggregated over a wide geographical area, regional PM pollution may have smaller errors in exposure estimates than more spatially varying local pollution. However, the relative strength of association between source-apportioned PM and health outcomes may not be interpretable as the relative causal role of the source types. To our knowledge, there has not yet been a systematic and quantitative evaluation of this issue. In this study, we attempt to evaluate this issue by analyzing newly available PM2.5 speciation data from three monitors (a few miles apart) in New York City during 2001-2002. The strongest temporal correlations across the three monitors were found for the individual PM. components that are related to secondary aerosols (e.g., S, NH4). We also conducted source-apportionment of the data using absolute principal component analysis and positive matrix factorization. We identified four major source/pollution types: (1) secondary (largely regional) aerosols; (2) soil; (3) traffic-related; and (4) residual oil burning/incineration, in each of the three monitors. The estimated source-apportioned PM2.5 mass showed generally the highest monitor-to-monitor correlation for the secondary aerosol factor (r range: 0.72-0.93). The correlation for the more localized traffic-related factor was more variable (r range: 0.26-0.95). The estimated mean PM2.5 mass contributions by source/pollution type across the monitors varied least for the secondary aerosol factor. The extent of variability in the source-apportioned PM2.5 mass by the monitor was comparable to that from the difference due to the two source-apportionment techniques used. The implication of the results of our study is that a source-oriented evaluation of PM health effects needs to take into consideration the uncertainty associated with spatial representative of the species measured at a single monitor. (C) 2004 Elsevier Ltd. All rights reserved
— id: 46492, year: 2004, vol: 38, page: 5269, stat: Journal Article,

Estimation of historical annual PM2.5 exposures for health effects assessment
Lall, R; Kendall, M; Ito, K; Thurston, GD
2004 OCT ;38(31):5217-5226, Atmospheric environment (Oxford)
Epidemiological studies have generally found fine particle metrics such as PM2.5 (PM mass less than 2.5 mun in aerodynamic diameter) to be more strongly related to adverse health effects than PM metrics that are not size-fractionated, such as total suspended particulate matter (TSP). The latency of long-term PM exposure effects on health could potentially be investigated using the American Cancer Society Cancer Prevention Study 11 cohort and other nationwide cohorts. Unfortunately, historical PM2.5 data are not available for many past years in most of the US. With the recent introduction of a PM2.5 National Ambient Air Quality Standard (NAAQS), fine particulate data is now available through the Environmental Protection Agency's (EAP's) Aerometric Information Retrieval System (AIRS) database from 1999 onwards. Using this nationwide PM2.5 data, we have estimated ratios Of PM2.5-PM10 (PM mass less than 10 mum in aerodynamic diameter) for more than 100 Metropolitan Statistical Areas (MSAs) in the US Similarly, using TSP and PM10 data from the late 1980's, when both metric were measured, we have derived PM10/TSP ratios for hundreds of US MSAs. These MSA-specific PM ratios allow the estimation of historical annual fine particulate concentrations, for as far back as 1972, using available annual TSP or PM 10 data. We found mean ratios Of PM2.5/ PM10= 0.54+/-0.14, and PM2.5/TSP = 0.30+/-0.11. The Inhalable Particle Network (IPN), a database independent of the AIRS database, monitored TSP and PM2.5 between 1979-1982. Using a subset of MSAs common to both databases, this dataset has been used to test our hypothesis that MSA-specific mass ratios could be used to estimate PM2.5 from PM10 and TSP. Raw IPN TSP-PM2.5 concentration correlations for MSAs were non-significant (R-2 = 0.00). Using the IPN TSP and our PM2.5/TSP ratios, mean PM2.5 estimates for 26 MSA were found to correlate with the measured IPN PM2.5 at R-2 = 0.43. These results indicate that it is possible to use MSA-specific PM mass ratios to predict historical annual mean PM2.5 exposure levels from past TSP and PM10 measurements. In addition, the MSA-specific ratios were used to estimate nationwide PM2.5 concentrations for 1972-2000. These results indicate that considerable progress has been made in reducing U.S. PM2.5 levels over the 30 years. (C) 2004 Elsevier Ltd. All rights reserved
— id: 46491, year: 2004, vol: 38, page: 5217, stat: Journal Article,

Health and environmental consequences of the world trade center disaster
Landrigan, Philip J; Lioy, Paul J; Thurston, George; Berkowitz, Gertrud; Chen, L C; Chillrud, Steven N; Gavett, Stephen H; Georgopoulos, Panos G; Geyh, Alison S; Levin, Stephen; Perera, Frederica; Rappaport, Stephen M; Small, Christopher
2004 May;112(6):731-739, Environmental health perspectives
The attack on the World Trade Center (WTC) created an acute environmental disaster of enormous magnitude. This study characterizes the environmental exposures resulting from destruction of the WTC and assesses their effects on health. Methods include ambient air sampling; analyses of outdoor and indoor settled dust; high-altitude imaging and modeling of the atmospheric plume; inhalation studies of WTC dust in mice; and clinical examinations, community surveys, and prospective epidemiologic studies of exposed populations. WTC dust was found to consist predominantly (95%) of coarse particles and contained pulverized cement, glass fibers, asbestos, lead, polycyclic aromatic hydrocarbons (PAHs), polychlorinated biphenyls (PCBs), and polychlorinated furans and dioxins. Airborne particulate levels were highest immediately after the attack and declined thereafter. Particulate levels decreased sharply with distance from the WTC. Dust pH was highly alkaline (pH 9.0-11.0). Mice exposed to WTC dust showed only moderate pulmonary inflammation but marked bronchial hyperreactivity. Evaluation of 10,116 firefighters showed exposure-related increases in cough and bronchial hyperreactivity. Evaluation of 183 cleanup workers showed new-onset cough (33%), wheeze (18%), and phlegm production (24%). Increased frequency of new-onset cough, wheeze, and shortness of breath were also observed in community residents. Follow-up of 182 pregnant women who were either inside or near the WTC on 11 September showed a 2-fold increase in small-for-gestational-age (SGA) infants. In summary, environmental exposures after the WTC disaster were associated with significant adverse effects on health. The high alkalinity of WTC dust produced bronchial hyperreactivity, persistent cough, and increased risk of asthma. Plausible causes of the observed increase in SGA infants include maternal exposures to PAH and particulates. Future risk of mesothelioma may be increased, particularly among workers and volunteers exposed occupationally to asbestos. Continuing follow-up of all exposed populations is required to document the long-term consequences of the disaster
— id: 72462, year: 2004, vol: 112, page: 731, stat: Journal Article,

Particulate and gaseous pollutant concentrations in South Bronx, NY
Maciejczyk, P; Xhillari, D; Offenberg, JH; Thurston, GD; Chen, LC
2004 JUL ;15(4):S68-S69, Epidemiology
— id: 47202, year: 2004, vol: 15, page: S68, stat: Journal Article,

Ambient pollutant concentrations measured by a mobile laboratory in South Bronx, NY
Maciejczyk, PB; Offenberg, JH; Clemente, J; Blaustein, M; Thurston, GD; Chen, LC
2004 OCT ;38(31):5283-5294, Atmospheric environment (Oxford)
The objective of this study is to characterize the ambient air quality of the South Bronx, New York City (NYC), having high concentrations of diesel trucks and waste transfer facilities. We employed a mobile laboratory for continuous measurements of concentrations of fine particulate matter (PM2.5), black carbon (BC), and gaseous pollutants at 6 locations for three-four weeks each during the period of April 2001-February 2003. Integrated 24-hr PM2.5 samples were also collected for elemental and PAHs analyses. South Bronx PM2.5 and BC levels were compared to those at Bronx PS 154 (NYSDEC site) and at Hunter College in the Lower Manhattan. Although the median daily PM2.5 concentrations agreed within 20%, the median hourly BC concentrations were higher at all South Bronx sites ranging from 2.2 to 3.8 mug m(-3), compared to 1.0-2.6 mug m(-3) at Hunter College. Continuous Aethelometer measurements at additional 27 sampling sites in the South Bronx were conducted along major highways. BC concentrations Varied within each site, depending on time-of-day, with a large spatial variability from site-to-site. Daily median BC concentrations varied from 1.7 to 12 mug m(-3) on the weekdays, and were lower (0.50-2.9 mug m(-3)) on the weekends; Elemental concentrations were higher at all South Bronx sites than those at Hunter College for all measured elements but Ni and V, and at the Hunts Point, an industrial location, were approximately 2.5-fold higher. The average sum of 35 PAHs was 225 ng m(-3), which is 4.5 times larger than representative regional concentrations in Jersey City, NJ. Among the individual PAHs, 3,6-dimethylphenanthrene had the highest concentrations, and the overall PAH fingerprint differed from signal for Jersey City. Our data indicates that highways encircling the South Bronx are having a measurable adverse influence on residents' exposure to pollutants compared to other NYC areas. (C) 2004 Elsevier Ltd. All rights reserved
— id: 46493, year: 2004, vol: 38, page: 5283, stat: Journal Article,

Vascular endothelial growth factor blockade reduces serum cytokines in a murine model of polymicrobial sepsis
Nolan A; Thurston G; Weiden MD; Gold JA
2004 ;169:A118-A118, American journal of respiratory & critical care medicine
— id: 101400, year: 2004, vol: 169, page: A118, stat: Journal Article,

Cardiovascular mortality and long-term exposure to particulate air pollution: epidemiological evidence of general pathophysiological pathways of disease
Pope, C Arden 3rd; Burnett, Richard T; Thurston, George D; Thun, Michael J; Calle, Eugenia E; Krewski, Daniel; Godleski, John J
2004 Jan 6;109(1):71-77, Circulation
BACKGROUND: Epidemiologic studies have linked long-term exposure to fine particulate matter air pollution (PM) to broad cause-of-death mortality. Associations with specific cardiopulmonary diseases might be useful in exploring potential mechanistic pathways linking exposure and mortality. METHODS AND RESULTS: General pathophysiological pathways linking long-term PM exposure with mortality and expected patterns of PM mortality with specific causes of death were proposed a priori. Vital status, risk factor, and cause-of-death data, collected by the American Cancer Society as part of the Cancer Prevention II study, were linked with air pollution data from United States metropolitan areas. Cox Proportional Hazard regression models were used to estimate PM-mortality associations with specific causes of death. Long-term PM exposures were most strongly associated with mortality attributable to ischemic heart disease, dysrhythmias, heart failure, and cardiac arrest. For these cardiovascular causes of death, a 10-microg/m3 elevation in fine PM was associated with 8% to 18% increases in mortality risk, with comparable or larger risks being observed for smokers relative to nonsmokers. Mortality attributable to respiratory disease had relatively weak associations. CONCLUSIONS: Fine particulate air pollution is a risk factor for cause-specific cardiovascular disease mortality via mechanisms that likely include pulmonary and systemic inflammation, accelerated atherosclerosis, and altered cardiac autonomic function. Although smoking is a much larger risk factor for cardiovascular disease mortality, exposure to fine PM imposes additional effects that seem to be at least additive to if not synergistic with smoking
— id: 48174, year: 2004, vol: 109, page: 71, stat: Journal Article,

Contribution of respiratory disease to nonrespiratory mortality associations with air pollution
De Leon, Samantha F; Thurston, George D; Ito, Kazuhiko
2003 Apr 15;167(8):1117-1123, American journal of respiratory & critical care medicine
Many time series studies have found that individuals with primary cardiac conditions were susceptible to the adverse effects associated with increased ambient particle levels. However, the mechanism(s) of these associations is not yet understood. In this study, we evaluate whether individuals with nonrespiratory primary causes of death who also had contributing respiratory causes listed on their death certificates were more affected by air pollution, as compared with those not having contributing respiratory conditions. Short-term associations between ambient particulate matter (10 microm or less in aerodynamic diameter) and mortality were modeled in New York City for the years 1985-1994. It was observed that among those 75 years or more, those with contributing respiratory disease had higher relative risks (95% confidence intervals) calculated per interquartile range, as compared with those without contributing respiratory disease for both circulatory deaths (relative risk = 1.066 [1.027-1.106] versus 1.022 [1.008-1.035]) and cancer deaths (relative risk = 1.129 [1.041-1.225] versus 1.025 [1.000-1.050]). However, this pattern of association was not observed for those who were less than 75 years old. The results of this study suggest that past studies may have underestimated the role of respiratory disease in pollution-mortality associations, especially among older adults
— id: 34507, year: 2003, vol: 167, page: 1117, stat: Journal Article,

Contribution of respiratory disease to nonrespiratory mortality associations with air pollution
Leon, S. F. de; Thurston, G. D.; Ito, K.
2003 ;167(8):1117-1123, American review of respiratory disease
Many time series studies have found that individuals with primary cardiac conditions were susceptible to the adverse effects associated with increased ambient particle levels. However, the mechanism(s) of these associations is not yet understood. In this study, we evaluate whether individuals with nonrespiratory primary causes of death who also had contributing respiratory causes listed on their death certificates were more affected by air pollution, as compared with those not having contributing respiratory conditions. Short-term associations between ambient particulate matter (10 micro m or less in aerodynamic diameter) and mortality were modelled in New York City, New York, USA for the years 1985-94. It was observed that among those 75 years or more, those with contributing respiratory disease had higher relative risks (95% confidence intervals) calculated per interquartile range, as compared with those without contributing respiratory disease for both circulatory d! eaths (relative risk=1.066 (1.027-1.106) versus 1.022 (1.008-1.035)) and cancer deaths (relative risk=1.129 (1.041-1.225) versus 1.025 (1.000-1.050)). However, this pattern of association was not observed for those who were less than 75 years old. The results of this study suggest that past studies may have underestimated the role of respiratory disease in pollution-mortality associations, especially among older adults
— id: 98786, year: 2003, vol: 167, page: 1117, stat: Journal Article,

Air pollution as an underappreciated cause of asthma symptoms
Thurston, George D; Bates, David V
2003 Oct 8;290(14):1915-1917, JAMA
— id: 38892, year: 2003, vol: 290, page: 1915, stat: Journal Article,

International expert workshop on the analysis of the economic and public health impacts of air pollution: workshop summary
Bell, Michelle L; Davis, Devra; Cifuentes, Luis; Cohen, Aaron; Gouveia, Nelson; Grant, Lester; Green, Collin; Johnson, Todd; Rogat, Jorge; Spengler, Jack; Thurston, George
2002 Nov;110(11):1163-1168, Environmental health perspectives
Forty-nine experts from 18 industrial and developing countries met on 6 September 2001 in Garmisch-Partenkirchen, Germany, to discuss the economic and public health impacts of air pollution, particularly with respect to assessing the public health benefits from technologies and policies that reduce greenhouse gas (GHG) emissions. Such measures would provide immediate public health benefits, such as reduced premature mortality and chronic morbidity, through improved local air quality. These mitigation strategies also allow long-term goals--for example, reducing the buildup of GHG emissions--to be achieved alongside short-term aims, such as immediate improvements in air quality, and therefore benefits to public health. The workshop aimed to foster research partnerships by improving collaboration and communication among various agencies and researchers; providing a forum for presentations by sponsoring agencies and researchers regarding research efforts and agency activities; identifying key issues, knowledge gaps, methodological shortcomings, and research needs; and recommending activities and initiatives for research, collaboration, and communication. This workshop summary briefly describes presentations made by workshop participants and the conclusions of three separate working groups: economics, benefits transfer, and policy; indoor air quality issues and susceptible populations; and development and transfer of dose-response relationships and exposure models in developing countries. Several common themes emerged from the working group sessions and subsequent discussion. Key recommendations include the need for improved communication and extended collaboration, guidance and support for researchers, advances in methods, and resource support for data collection, assessment, and research
— id: 34509, year: 2002, vol: 110, page: 1163, stat: Journal Article,

World Trade Center cough
Chen, Lung Chi; Thurston, George
2002 Dec;360 Suppl(8):s37-s38, Lancet
— id: 38893, year: 2002, vol: 360 Suppl, page: s37, stat: Journal Article,

Lung cancer, cardiopulmonary mortality, and long-term exposure to fine particulate air pollution
Pope, C Arden 3rd; Burnett, Richard T; Thun, Michael J; Calle, Eugenia E; Krewski, Daniel; Ito, Kazuhiko; Thurston, George D
2002 Mar 6;287(9):1132-1141, JAMA
CONTEXT: Associations have been found between day-to-day particulate air pollution and increased risk of various adverse health outcomes, including cardiopulmonary mortality. However, studies of health effects of long-term particulate air pollution have been less conclusive. OBJECTIVE: To assess the relationship between long-term exposure to fine particulate air pollution and all-cause, lung cancer, and cardiopulmonary mortality. DESIGN, SETTING, AND PARTICIPANTS: Vital status and cause of death data were collected by the American Cancer Society as part of the Cancer Prevention II study, an ongoing prospective mortality study, which enrolled approximately 1.2 million adults in 1982. Participants completed a questionnaire detailing individual risk factor data (age, sex, race, weight, height, smoking history, education, marital status, diet, alcohol consumption, and occupational exposures). The risk factor data for approximately 500 000 adults were linked with air pollution data for metropolitan areas throughout the United States and combined with vital status and cause of death data through December 31, 1998. MAIN OUTCOME MEASURE: All-cause, lung cancer, and cardiopulmonary mortality. RESULTS: Fine particulate and sulfur oxide--related pollution were associated with all-cause, lung cancer, and cardiopulmonary mortality. Each 10-microg/m(3) elevation in fine particulate air pollution was associated with approximately a 4%, 6%, and 8% increased risk of all-cause, cardiopulmonary, and lung cancer mortality, respectively. Measures of coarse particle fraction and total suspended particles were not consistently associated with mortality. CONCLUSION: Long-term exposure to combustion-related fine particulate air pollution is an important environmental risk factor for cardiopulmonary and lung cancer mortality
— id: 72117, year: 2002, vol: 287, page: 1132, stat: Journal Article,

Risk communication in the aftermath of the World Trade Center disaster
Thurston, George D; Chen, Lung Chi
2002 Dec;42(6):543-544, American journal of industrial medicine
— id: 34508, year: 2002, vol: 42, page: 543, stat: Journal Article,

Assessing the health benefits of urban air pollution reductions associated with climate change mitigation (2000-2020): Santiago, Sao Paulo, Mexico City, and New York City
Cifuentes L; Borja-Aburto VH; Gouveia N; Thurston G; Davis DL
2001 Jun;109 Suppl 3(5533):419-425, Environmental health perspectives
To investigate the potential local health benefits of adopting greenhouse gas (GHG) mitigation policies, we develop scenarios of GHG mitigation for Mexico City, Mexico; Santiago, Chile; Sao Paulo, Brazil; and New York, New York, USA using air pollution health impact factors appropriate to each city. We estimate that the adoption of readily available technologies to lessen fossil fuel emissions over the next two decades in these four cities alone will reduce particulate matter and ozone and avoid approximately 64,000 (95% confidence interval [CI] 18,000-116,000) premature deaths (including infant deaths), 65,000 (95% CI 22,000-108,000) chronic bronchitis cases, and 46 million (95% CI 35-58 million) person-days of work loss or other restricted activity. These findings illustrate that GHG mitigation can provide considerable local air pollution-related public health benefits to countries that choose to abate GHG emissions by reducing fossil fuel combustion
— id: 34511, year: 2001, vol: 109 Suppl 3, page: 419, stat: Journal Article,

Climate change. Hidden health benefits of greenhouse gas mitigation
Cifuentes L; Borja-Aburto VH; Gouveia N; Thurston G; Davis DL
2001 Aug 17;293(5533):1257-1259, Science
— id: 34510, year: 2001, vol: 293, page: 1257, stat: Journal Article,

The burden of air pollution: impacts among racial minorities
Gwynn RC; Thurston GD
2001 Aug;109 Suppl 4(9):501-506, Environmental health perspectives
Various epidemiologic investigations have shown that ambient air pollution levels are associated with acute increases in hospital admissions and mortality in the United States and abroad. The objectives of this investigation were a) to determine if racial minorities are more adversely affected by ambient air pollution than their white counterparts and b) to assess the contribution of socioeconomic status to any observed racial differences in pollution effect. Time-series regression methods were conducted to investigate these hypotheses for daily respiratory hospital admissions in New York City, New York. Pollutants considered included mean daily levels of particulate matter with a mass median aerodynamic diameter less than 10 microm (PM(10), ozone (O3), strong aerosol acidity (H+), and sulfates (SO4(2). The relative risk for respiratory hospital admission was calculated for each pollutant for a maximum minus mean increment in mean daily pollutant concentration. The greatest difference between the white and nonwhite subgroups was observed for O(3), where the white relative risk (RR) was 1.032 [95% confidence interval (CI): 0.977-1.089] and the nonwhite RR was 1.122 (95%CI: 1.074-1.172). Although not statistically different from each other, the various pollutants' RR estimates for the Hispanic nonwhite category in New York City were generally larger in magnitude than those for the non-Hispanic white group. When these analyses incorporated differences in the underlying respiratory hospitalization rates across races (that for nonwhites, was roughly twice that for whites), the disparities in attributable risks from pollution (in terms of excess admissions per day per million persons) were even larger for nonwhites versus whites. However, when insurance status was used as an indicator of socioeconomic/health coverage status, higher RRs were indicated for the poor/working poor (i.e., those on Medicaid and the uninsured) than for those who were economically better off (i.e., the privately insured), even among non-Hispanic whites. Thus, although potential racial differences in pollution exposures could not be explored as a factor, within-race analyses suggested that most of the apparent differences in air pollutant effects found across races were explained by socioeconomic and/or health care disparities
— id: 26670, year: 2001, vol: 109 Suppl 4, page: 501, stat: Journal Article,

Monitor-to-monitor temporal correlation of air pollution and weather variables in the North-Central U.S
Ito K; Thurston GD; Nadas A; Lippmann M
2001 Jan-Feb;11(1):21-32, Journal of exposure analysis & environmental epidemiology
Numerous time series studies have reported associations between daily ambient concentrations of air pollution and morbidity or mortality. Recent personal exposure studies have also reported relatively high longitudinal correlation between personal exposures to particulate matter (PM) and home outdoor PM concentrations, lending support to the health effects reported in time series studies. However, the question remains as to how well the temporal fluctuations in the air pollution levels observed at an outdoor monitor represent the temporal fluctuations in the population exposures to pollution of outdoor origins in a city, and how such representativeness affects the size and significance of risk estimates. Also, such spatio-temporal correlations would vary from pollutant to pollutant, likely influencing their relative significance of statistical associations with health outcomes. In this study, we characterized the extent of monitor-to-monitor correlation over time among multiple monitoring sites for PM less than 10 microm (PM10), gaseous criteria pollutants, and several weather variables in seven central and eastern contiguous states (IL, IN, MI, OH, PA, WI, and WV) during the study period of 1988-1990. After removing seasonal trends, the monitor-to-monitor temporal correlation among the air pollution/weather variables within 100-mile separation distance in these areas could be generally ranked into three groups: (1 ) temperature, dew point, relative humidity (r>0.9); (2) O3, PM10, NO2 (r: 0.8-0.6); and (3) CO, SO2 (r<0.5). Using the subsets for separation distance less than 100 miles, regression analyses of these monitor-to-monitor correlation coefficients were also conducted with explanatory variables including separation distance, qualitative (land use, location setting, and monitoring objectives) and quantitative (large and small variance) site characteristics, and region indicators for Air Quality Control Region (AQCR). The separation distance was a significant predictor of monitorto-monitor correlation decline especially for PM10 and NO2 (approximately 0.2 drop over 30 miles). Site characteristic variables were, in some cases, significant predictors of monitor-to-monitor correlation, but the magnitude of their impacts was not substantial. Regional differences, as examined by AQCR, were in some cases (e.g., in Metropolitan Philadelphia) substantial. In these areas, the pollutants that had generally poor monitor-to-monitor correlation in the overall seven states data (i.e., for SO2 and CO) showed higher monitor-to-monitor correlations, comparable with PM10 and O3, within the AQCR. These results are useful in interpreting some of the past time series epidemiological results. The differences in monitor-to-monitor correlations found across pollutants in this work (i.e., r approximately 0.8 vs. r approximately 0.4) are sufficiently large that they could be a factor in the different pollutant significance levels reported in the epidemiologic literature. It is recommended that future epidemiological studies collect and incorporate information on spatial variability among air pollutants in the analysis and interpretation of their results
— id: 18507, year: 2001, vol: 11, page: 21, stat: Journal Article,

Epidemiological studies of acute ozone exposures and mortality
Thurston GD; Ito K
2001 Jul-Aug;11(4):286-294, Journal of exposure analysis & environmental epidemiology
Many, but not all, observational epidemiological studies of ozone (O(3)) air pollution have yielded significant associations between variations in daily ambient concentrations of this pollutant and a wide range of adverse health outcomes. We evaluate some past epidemiological studies that have assessed the short-term association of O(3) with mortality, and investigate one possible reason for variations in their O(3) effect estimate, i.e., differences in their approaches to the modeling of weather influences on mortality. For all of the total mortality-air pollution time-series studies considered, the combined analysis yielded a relative risk, RR=1.036 per 100-ppb increase in daily 1-h maximum O(3) (95% CI: 1.023-1.050). However, the subset of studies that specified the nonlinear nature of the temperature-mortality association yielded a combined estimate of RR=1.056 per 100 ppb (95% CI: 1.032-1.081). This indicates that past time-series studies using linear temperature-mortality specifications have underpredicted the premature mortality effects of O(3) air pollution. For Detroit, MI, an illustrative analysis of daily total mortality during 1985-1990 also indicated that the model weather specification choice can influence the O(3) health effects estimate. Results were intercompared for alternative weather specifications. Nonlinear specifications of temperature and relative humidity (RH) yielded lower intercorrelations with the O(3) coefficient, and larger O(3) RR estimates, than a base model employing a simple linear spline of hot and cold temperature. We conclude that, unlike for particulate matter (PM) mass, the mortality effect estimates derived by time-series analyses for O(3) can be sensitive to the way that weather is addressed in the model. The same may well also be true for other pollutants with largely temperature-dependent formation mechanisms, such as secondary aerosols. Generally, we find that the O(3)-mortality effect estimate increases in size and statistical significance when the nonlinearity and the humidity interaction of the temperature-health effect association are incorporated into the model weather specification. We recommend that a minimization of the intercorrelations of model coefficients be considered (along with other critical factors such as goodness of fit, autocorrelation, and overdispersion) when specifying such a model, especially when individual coefficients are to be interpreted for risk estimation
— id: 26652, year: 2001, vol: 11, page: 286, stat: Journal Article,

A time-series analysis of acidic particulate matter and daily mortality and morbidity in the Buffalo, New York, region
Gwynn RC; Burnett RT; Thurston GD
2000 Feb;108(2):125-133, Environmental health perspectives
A component of particulate matter (PM) air pollution that may provide one biologically plausible pathway for the observed PM air pollution-health effect associations is aerosol acidity (H(+)). An increasing number of observational studies have demonstrated associations between H(+) and increased adverse health effects in the United States and abroad. Although studies have shown significant H(+) associations with increased morbidity in the United States, similar associations have yet to be shown with daily mortality. We considered a 2.5-year record of daily H(+) and sulfate measurements (May 1988-October 1990) collected in the Buffalo, New York, region in a time-series analysis of respiratory, circulatory, and total daily mortality and hospital admissions. Other copollutants considered included particulate matter [less than/equal to] 10 microm in aerodynamic diameter, coefficient of haze, ozone, carbon monoxide, sulfur dioxide, and nitrogen dioxide. Various modeling techniques were applied to control for confounding of effect estimates due to seasonality, weather, and day-of-week effects. We found multiple significant pollutant-health effect associations--most strongly between SO(4)(2-) and respiratory hospital admissions (as indicated by its t-statistic). Additionally, H(+) and SO(4)(2-) demonstrated the most coherent associations with both respiratory hospital admissions [H(+): relative risk (RR) = 1. 31; 95% confidence interval (CI), 1.14-1.51; and SO(4)(2-): RR = 1. 18, CI, 1.09-1.28] and respiratory mortality (H(+): RR = 1.55, CI, 1. 09-2.20; and SO(4)(2-): RR = 1.24, CI, 1.01-1.52). Thus, acidic sulfate aerosols represent a component of PM air pollution that may contribute to the previously noted adverse effects of PM mass on human health, and the associations demonstrated in this study support the need for further investigations into the potential health effects of acidic aerosols
— id: 10354, year: 2000, vol: 108, page: 125, stat: Journal Article,

Determinants of endothelial cell phenotype in venules
Thurston G; Baluk P; McDonald DM
2000 Feb;7(1):67-80, Microcirculation
Inflammatory stimuli cause plasma leakage and leukocyte adhesion in venules but not in capillaries or arterioles. The specific response of venules is governed by phenotypic specialization of the venular endothelial cells. What regulates this specialized phenotype? Several recent developments have shed new light on this question and may challenge our thinking about regulation of the venular endothelial cell phenotype. In this review, we consider some of the molecular markers of venular endothelial cells, the hemodynamic and molecular factors that may regulate the phenotype of venular endothelial cells, and abnormalities in endothelial cell phenotype in disease-related angiogenesis and microvascular remodeling. The expanding list of molecular markers may help clarify the physiologic and molecular factors that regulate the phenotype of venular endothelial cells in normal development and disease
— id: 34512, year: 2000, vol: 7, page: 67, stat: Journal Article,

Cigarette smoking and ozone-associated emergency department use for asthma by adults in New York City
Cassino C; Ito K; Bader I; Ciotoli C; Thurston G; Reibman J
1999 Jun;159(6):1773-1779, American journal of respiratory & critical care medicine
The association between ambient ozone (O3) and hospital use for asthma in children and adults is well documented. The question remains of whether there are susceptible subpopulations of asthmatic individuals who are particularly vulnerable to high O3 levels. Because tobacco use was prevalent in our cohort of inner-city adult asthmatic individuals (n = 1,216) in New York City (NYC), we investigated whether cigarette smoking was an effect modifier for asthma morbidity. We examined the relationship between personal tobacco use and O3-associated emergency department (ED) use for asthma in public hospitals in NYC. Three subpopulations were defined: never smokers (0 pack-yr), heavy smokers (>/= 13 pack-yr) and light smokers (< 13 pack-yr). Time-series regression analysis of ED use for asthma and daily O3 levels was done while controlling for temperature, seasonal/long-term trends, and day-of-week effects. Heavy smokers displayed an increased relative risk (RR) of ED visits for asthma in response to increases in 2-d lagged O3 levels (RR per 50 ppb O3 = 1.72; 95% confidence interval: 1.13 to 2.62). Logistic regression analysis confirmed that heavy cigarette use was a predictor of ED use for asthma following days with high O3 levels. Although adverse health effects of ambient O3 have also been documented in asthma populations not using cigarettes (e.g., children), our results suggest that in adult asthmatic individuals, heavy personal tobacco use may be an effect modifier for O3-associated morbidity
— id: 6126, year: 1999, vol: 159, page: 1773, stat: Journal Article,

Personal exposure to PM of outdoor and indoor origin
Lippmann, M; Thurston, GD; Ito, K; Reibman, J; Xue, N; Heikkinen, M
1999 JUL ;10(4):140O-910, Epidemiology
— id: 98319, year: 1999, vol: 10, page: 140O, stat: Journal Article,

Summertime haze air pollution and children with asthma [see comments]
Thurston GD; Lippmann M; Scott MB; Fine JM
1997 Feb;155(2):654-660, American journal of respiratory & critical care medicine
In order to investigate associations between summertime haze air pollution and asthma at an individual level, 52, 58, and 56 children (ages 7 to 13) attending a summer 'asthma camp' were followed during the last week of June in 1991, 1992, and 1993, respectively. Most of the subjects had moderate to severe asthma. Daily records were kept of the environmental conditions, as well as of subject medication use, lung function, and medical symptoms. Air pollution was found to be significantly and consistently correlated with acute asthma exacerbations, chest symptoms, and lung function decrements. The pollutant most consistently associated with adverse health consequences was ozone (O3), although associations with sulfates and hydrogen ion suggest a possible role by fine particles as well. Effects were found to be roughly monotonic as a function of O3 concentration. Regression of morning (8:00 A.M.) to afternoon (5:00 P.M.) peak flow change on O3 indicated pulmonary function reductions similar to those previously reported for more active children without asthma. Moreover, analyses also indicated an increased risk of an asthma exacerbation and of experiencing chest symptoms of approximately 40% on the highest pollution day, relative to the mean. Based on these relative risk estimates, a rise in the 1-h daily maximal O3 from 84 ppb to 160 ppb was associated in this group with an increase from 20 to 28 (+/- 2) in the expected number of unscheduled medications administered/day, and from 29 to 41 (+/- 3) in the expected total number of chest symptoms/day. Thus, air pollution can be a major contributor to the respiratory problems experienced by children with asthma during the summer months
— id: 10363, year: 1997, vol: 155, page: 654, stat: Journal Article,

Daily PM10/mortality associations: an investigations of at-risk subpopulations
Ito K; Thurston GD
1996 Jan-Mar;6(1):79-95, Journal of exposure analysis & environmental epidemiology
Recent time-series epidemiological studies have reported significant associations between daily air pollution and mortality. These studies typically report a short-term excess increase in deaths as the fractional increase of total (nonaccidental) deaths per unit of air pollutant. The relative risk (RR) calculated for the total population in these studies, however, may underestimate the risk for the most sensitive subpopulation(s) at risk. In this study, race, gender, and cause-specific counts of daily mortality in Cook County, Illinois (which encompasses the city of Chicago) during 1985-1990 were analyzed to determine if there was any heterogeneity in air pollution/weather/mortality associations across these various population subcategories. Seasonal cross-correlations between mortality and environmental variables first were examined to identify appropriate lag structures. Of the pollution variables considered-particulate matter less than 10 microns (PM10), ozone, carbon monoxide, sulfur dioxide, and visual range-derived extinction coefficient-both PM10 and ozone showed significant associations with same-day and next-day mortality. The Poisson regression models employed included seasonal cycles (sine/cosine series), square and linear terms of lagged temperature, trend line, day-of-week dummy variables, and the average of the same day's and previous day's PM10 or ozone. The RR for total nonaccidental mortality per 100 micrograms/m3 increase in PM10 was 1.05 (95% CI: 1.03-1.08). The respiratory (RR = 1.14; 95% CI: 1.04-1.25) and cancer (RR = 1.12; 95% CI: 1.06-1.18) categories showed higher estimates than the circulatory category (RR = 1.03; 95% CI: 0.98-1.07), while the residual of the total from these three categories showed no association with PM10 (RR = 1.01; 95% CI: 0.95-1.08). Among the race- and gender-specific categories, black (African-American) females showed the higher RRs for the total (RR = 1.11; 95% CI: 1.03-1.21), respiratory (RR = 1.31; 95% CI: 0.98-1.75), and cancer (RR = 1.25; 95% CI: 1.07-1.46) mortality categories. Neither ozone nor hot temperature showed such cause-specificity in mortality associations. Cold temperature lagged by two days was a significant predictor of circulatory and respiratory mortality. This study suggests the importance of race- and gender-specific analysis. The greater mortality risk to Chicago's black women from exposure to urban air pollution indicated by this finding should be tested in other metropolitan areas
— id: 10376, year: 1996, vol: 6, page: 79, stat: Journal Article,

The effects of ambient ozone on lung function in children: a reanalysis of six summer camp studies
Kinney PL; Thurston GD; Raizenne M
1996 Feb;104(2):170-174, Environmental health perspectives
Studies of children attending summer camps often have observed relationships between daily outdoor ozone (O3) concentrations and decreased lung function that are qualitatively similar to results seen in human chamber studies. The former studies, focusing on the pulmonary effects of O3 and associated pollutants on children under natural conditions of exposure, are potentially of great importance to understanding the public health impact of ambient O3. However, a thorough assessment of the results of these studies has been hampered by differences in the analysis and reporting of data across the various studies. We obtained data sets from six summer camp studies carried out by three separate investigative groups, including two New Jersey studies performed by New York University, two studies in Ontario carried out by Health and Welfare Canada, and two studies in southern California. The data consisted of sequential, daily measurements of forced expiratory volume in 1 sec (FEV1), peak expiratory flow rate (PEFR), and 1-hr O3 concentration in the hour preceding lung function measurements for each child. We analyzed the relationships between lung function and O3 using linear regression models that fit subject-specific intercepts and a single, pooled O3 slope. These models were fit for each of the six studies separately and for all studies combined. All of the study-specific slopes of FEV1 on O3 were negative (i.e., increased O3 associated with decreased FEV1); five of six were statistically significant. Analysis of the combined six-study data set yielded a slope of -0.50 ml FEV1/ppb O3 (p<0.0001). Addition of time-trend variables to the combined-data analysis diminished, but did not eliminate, the FEV1-O3 relationship. Study-specific slopes for PEFR on O3 were more variable. Combined over studies, no significant relationship was observed between PEFR and O3. However, this negative finding appeared to be partially confounded by time trends in PEFR. The results of this reanalysis provide strong evidence that children exposed to O3 under natural conditions experience decreases in FEV1 of the kind demonstrated in laboratory studies, and raise concern that other acute respiratory effects observed in those studies (e.g., pulmonary inflammation) may also occur in young people exposed to ambient O3
— id: 18508, year: 1996, vol: 104, page: 170, stat: Journal Article,

Sulfate concentrations as an indicator of ambient particulate matter air pollution for health risk evaluations
Lippmann M; Thurston GD
1996 Apr-Jun;6(2):123-146, Journal of exposure analysis & environmental epidemiology
Retrospective population studies that have compared regression coefficients for mortality and morbidity for sulfate (SO4(2-), fine particles (PM2.5; aerodynamic diameter < 2.5 microns), thoracic particles (PM10; aerodynamic diameter < 10 microns), and total suspended particulates (TSP; undefined and variable upper cut-size) generally have found SO4(2-) concentrations to be correlated with effects as well as or better than PM2.5. In addition, both SO4(2-) and PM2.5 have yielded somewhat stronger associations with adverse health effects than PM10, and much stronger associations than TSP. Sulfate has advantages over PM2.5 for retrospective epidemiology, at least in the United States, because considerably more data on sulfate have been collected in recent decades, and there is a broader epidemiological database in the literature for comparison to other studies. While SO4(2-), per se, is an unlikely causal factor for mortality or morbidity, it often is correlated closely with variations in the strong acid component of ambient particulate matter (H+) and PM2.5 concentrations (especially in summer), which are more likely causal factors. A detailed analysis of the SO4(2-) epidemiological database is presented in this paper. In addition, drawing on our substantial archives of SO4(2-) and H+ data, we show that SO4(2-) and H+ correlate, both spatially and over time, in the eastern United States. We demonstrate the utility of SO4(2-) as a useful surrogate for ambient PM2.5 and H+ in epidemiological studies and as an index of PM exposure in ambient air quality guidelines and standards
— id: 8013, year: 1996, vol: 6, page: 123, stat: Journal Article,

Intercommunity differences in acid aerosol (H+)/sulfate (SO4(2-) ratios
Ozkaynak, H; Xue, J; Zhou, H; Spengler, J D; Thurston, G D
1996 Jan-Mar;6(1):35-55, Journal of exposure analysis & environmental epidemiology
Exposures to acid aerosols have been associated with acute and chronic health effects. Beginning in 1988, extensive monitoring of acid aerosols (H+), sulfates (SO4(2-)), and ammonia (NH3) was conducted in 24 communities in the United States and Canada in order to characterize the seasonal and daily variations of these pollutants. More recently, in 1992 and 1993, summer monitoring of the same pollutants was conducted by Harvard researchers at multiple locations in Philadelphia, Pennsylvania to examine the factors causing spatial variation in the acidity levels in the greater metropolitan Philadelphia area. Earlier, a similar study also was conducted by Harvard in a more rural community, State College, Ohio, providing data on acidity, sulfate, and ammonia levels. In addition to these studies, New York University researchers have gathered substantial data on aerosol acidity, sulfates, and NH3 levels from sites in the New York City metropolitan region, Albany, Buffalo, and the Toronto metropolitan region between 1988 and 1992. This paper examines the relationships among H+, SO4(2-), ozone, and population density using summer measurements from sites in 24 cities across the United States and Canada, as well as Philadelphia, State College, the New York City region, Buffalo, and Albany. While past studies have consistently shown that H+ and SO4(2-) are correlated over time at sites in eastern North America, the results of our analysis show that spatial variations in the ratios of mean acid-to-sulfate levels also can be predicted satisfactorily with the use of either a linear or a quadratic model, once variations in population density are addressed (R2 = 0.6). These models may be useful in retrospective epidemiological investigations of acid aerosol exposures and health effects, using widely available sulfate measurements and data on local population size
— id: 72118, year: 1996, vol: 6, page: 35, stat: Journal Article,

A critical review of PM10-mortality time-series studies
Thurston GD
1996 Jan-Mar;6(1):3-21, Journal of exposure analysis & environmental epidemiology
While the mortality effects of particulate matter (PM) have been obvious during extreme historical pollution episodes (e.g., the London Fog of 1952), evaluating effects at more routine pollution levels has required the use of complex statistical modeling approaches. This paper critically reviews available time-series studies on PM10 mortality to provide a common basis for an evaluation of the PM10-mortality association. These PM10 studies confirm that an acute pollution-mortality association can occur at routine ambient levels, and suggest that such effects extend below the present United States air quality standards, especially for susceptible subpopulations. Furthermore, these new PM10 studies are consistent with the hypothesis noted in past studies that PM is a causal agent in the mortality impacts of air pollution. The relative risks (RRs) for PM10 mortality, however, were found to vary across studies. Variation probably was caused by differences in PM10 composition and in the PM10 averaging period employed in the analysis, as well as differences in whether other pollutants were considered simultaneously in the mortality-PM10 model. Overall, the RR estimates derived from available PM10-total mortality studies suggest a 24-h average, 100 micrograms/m3 PM10 acute exposure effect on the order of RR approximately 1.05-1.10 in the general population. Higher PM10 RRs were indicated for the elderly and for those with preexisting respiratory conditions, both of which represent subpopulations who appear to be especially at risk for the mortality implications of acute exposures to air pollution. A key research question remaining involves a determination of the component or components of PM10 (e.g., fine particles, sulfates, acid aerosols, or ultrafine particles) that are most important to the noted acute PM-mortality associations
— id: 12687, year: 1996, vol: 6, page: 3, stat: Journal Article,

VARIATIONS IN PM-10 CONCENTRATIONS WITHIN 2 METROPOLITAN-AREAS AND THEIR IMPLICATIONS FOR HEALTH-EFFECTS ANALYSES
ITO, K; KINNEY, PL; THURSTON, GD
1995 JUL ;7(5):735-745, Inhalation toxicology
Temporal variations of PM-10 levels at multiple sites between 1985 and 1990 in two major metropolitan areas, Cook County, IL, and Los Angeles County, CA, were characterized, and sensitivity of mortality-PM-10 associations to the choice of alternate sites was examined. In both cities, the correlation of PM-10 levels among multiple sites decreased as their distance increased. While averaging PM-10 concentrations over multiple sites generally improved the significance of PM-10-mortality associations, the highest PM-10-mortality association in Cook County was found for an individual site. In Cook County, the magnitude of the mortality association for the average of 6 PM-10 sites, as expressed as ''relative risk'' per 100 mu g/m(3) PM-10, was similar (RR = 1.06, 95% CI 1.01-1.10) to those reported in other PM-10 studies with similar model specifications. However, the significance of regression coefficients for individual PM-10 sites varied considerably it ratios range -0.62 to 3.30). Furthermore, every-6-days subsamples of the daily data at a site in Cook County showed a wide range in the significance of regression coefficients (t ratios range -0.17 to 3.44). This variability of significance among the six sites may be partly due to their small sample sizes (n approximate to 300), which raises concern regarding the potential for compromised statistical power of health effects analyses in ''short'' study periods (<6 yr) at the current every-6-days sampling frequency used for most PM-10 monitors in the United States. Also, the qualitative site information available, such as land use, location setting, and monitoring objective, did not show any coherent influence on the site's PM-10-mortality association's significance. Overall, it was found that the choice of PM-10 sites and sampling frequency can make a substantial difference in the calculated significance of such health effects time-series analysis
— id: 87251, year: 1995, vol: 7, page: 735, stat: Journal Article,

A SENSITIVITY ANALYSIS OF MORTALITY PM-10 ASSOCIATIONS IN LOS-ANGELES
KINNEY, PL; ITO, K; THURSTON, GD
1995 JAN-FEB ;7(1):59-69, Inhalation toxicology
Several recent studies have reported statistically significant and quantitatively similar associations between daily mortality and PM-10 or total suspended particulates (TSP). These results have raised questions of biological plausibility, as well as questions regarding the statistical methods employed, which are relatively new and not widely understood. This article evaluates the sensitivity of mortality/PM-10 results to a range of statistical methods in a newly developed data set from Los Angeles county for the period 1985-1990. Data reported here include total daily deaths (excluding accidents and suicides), 24-h average PM-10, daily 7-h maximum O-3 and carbon monoxide, maximum daily temperature, and mean daily relative humidity. Analyses were limited to the subset oi days on which PM-10 data were available (every sixth day). Several alternative methods for addressing each of four issues were explored in this data set These four issues were cyclic data variations, weather influences, other air pollutants, and the distribution of residuals. The associations between mortality and PM-10 concentrations, measured as relative risks associated with a 100-mu g/m(3) increase in PM-10, were only mildly sensitive to the alternative statistical methods. In particular, no difference was observed between the results of ordinary least squares and Poisson models. We observed a relative risk of about 1.05, which is similar to, but somewhat smaller than, the mortality/PM-10 relative risks reported in recent studies. These new results add to the growing body of data suggesting that current levels of airborne particulate matter may contribute to excess deaths in the United States
— id: 87454, year: 1995, vol: 7, page: 59, stat: Journal Article,

AIR-POLLUTION EPIDEMIOLOGY - CONSIDERATIONS IN TIME-SERIES MODELING
THURSTON, GD; KINNEY, PL
1995 JAN-FEB ;7(1):71-83, Inhalation toxicology
Recent epidemiological studies have indicated that ambient air pollution, including PM-10, is associated with excess mortality and morbidity. These studies have included both cross-sectional comparisons across communities and rime-series analyses over time in single communities. Time-series analysis offers certain advantages, primarily in that the study population is the same over time, so that it acts as its own ''control.'' However, modeling such data is complicated by the fact that other environmental factors and other causes of illness can confound the results unless they are adequately addressed. For example, wintertime influenza epidemics cause long-wave peaks in respiratory mortality, and variations in emissions, dispersion, and atmospheric chemistry can cause seasonal cycles in pollution. Such superimposed long-wave variations in both health outcomes and pollutant concentrations can undermine the statistical validity of time-series models by inducing autocorrelation, and can create long-wave ''noise'' signals that can overwhelm a short-term ''signal'' of interest. Also, model specification can strongly affect the results of a time-series model. For example, analyses focusing on only one routinely collected pollution metric, to the exclusion of other possibly more influential pollution components, can cause the effects of the overlooked pollutants to be ascribed to the studied pollutant. In addition, the potential effects of nonnormal (e.g., Poisson) data distributions on time-series results need to be considered. It is concluded that how these various time-series modeling factors are, or are not, addressed can have a large influence on the study conclusions, or the ''message'' resulting from such analyses. Sensitivity analyses incorporating multiple modeling methods and model specifications are therefore recommended as part of such an analysis. Moreover, in this article exploratory and diagnostic procedures are recommended that may aid the modeler in assessing and avoiding the noted problems and that will allow the validity of such studies to be more easily documented and intercompared
— id: 87455, year: 1995, vol: 7, page: 71, stat: Journal Article,

The nature and origins of acid summer haze air pollution in metropolitan Toronto, Ontario
Thurston GD; Gorczynski JE Jr; Currie JH; He D; Ito K; Hipfner J; Waldman J; Lioy PJ; Lippmann M
1994 May;65(2):254-270, Environmental research
During July and August of 1986, 1987, and 1988, a field study was conducted of ambient acidic aerosol levels in Toronto, Ontario. Fine particle mass (da < 2.5 microns) samples were collected twice daily at a central-city site for the determination of particulate-phase strong acidity (H+) and sulfate (SO4 =). Two additional H(+)-monitoring sites were concurrently operated during the summers of 1986 and 1987 to examine the spatial variability of H+ within the metropolitan area. During the summer of 1986, a quasi-continuous total sulfate/sulfuric acid analyzer was also deployed to allow a determination of the chemical form of H+. Results indicate that acid aerosol episodes (H+ > or = 100 nmole/m3) did occur in this city during the summer months, and that H+ peaks were well correlated with sulfate peaks. Virtually all of the H+ was found to be present as ammonium bisulfate (NH4HSO4). While H+ concentrations were highly correlated among the three monitoring sites (r = 0.9), the highest H+/SO4 = ratios prevailed during SO4 = episode periods and at the least urbanized site. This latter trend was apparently due to greater neutralization of H+ by local ammonia at the more urbanized sites. Comparisons of day vs night H+/SO4 = ratios, an examination of air mass back-trajectories, and contemporaneous H+ measurements at surrounding sites collectively indicated that transported regional haze air pollution from the United States is a major contributor to the H+ events recorded within Toronto
— id: 6536, year: 1994, vol: 65, page: 254, stat: Journal Article,

Respiratory hospital admissions and summertime haze air pollution in Toronto, Ontario: consideration of the role of acid aerosols
Thurston GD; Ito K; Hayes CG; Bates DV; Lippmann M
1994 May;65(2):271-290, Environmental research
A study of air pollution and daily hospital admissions for respiratory causes was conducted in Toronto, Ontario. Fine aerosol (da < 2.5 microns) samples were collected daily at a central city site during July and August 1986, 1987, and 1988 and were subsequently extracted and analyzed for daily particulate phase aerosol strong acidity (H+) and sulfates (SO4 =). Daily counts of respiratory admissions to 22 acute care hospitals and daily meteorological and environmental data (e.g. ozone [O3], total suspended particulate matter [TSP], and thoracic particle mass [PM10] were also obtained. Regression analyses indicated that only the O3, H+, and SO4 = associations with respiratory and asthma admissions remained consistently significant after controlling for temperature. Even after excluding days with maximum 1-hr O3 > 120 ppb, O3 was still strongly significant. In the various model specifications considered, the relative particle metric strengths of association with admissions were generally H+ > SO4 = > FP > PM10 > TSP, indicating that particle size and composition are of central importance in defining the adverse human health effects of particulate matter. On average, summertime haze air pollution was associated with 24% of all respiratory admissions (21% with O3, 3% with H+). On peak pollution days, however, aerosol acidity yielded the highest relative risk estimates (e.g., RR = 1.5 at 391 nmole/m3 H+), and summertime haze was associated with roughly half of all respiratory admissions
— id: 6535, year: 1994, vol: 65, page: 271, stat: Journal Article,

Associations of London, England, daily mortality with particulate matter, sulfur dioxide, and acidic aerosol pollution
Ito K; Thurston GD; Hayes C; Lippmann M
1993 Jul-Aug;48(4):213-220, Archives of environmental health
During the extreme pollution episodes of 1952 and 1962 in London, England, excesses in daily mortality were clearly evident. In this study, we examined daily British Smoke, sulfur dioxide, acid aerosols, and weather variables for their short-term associations with daily mortality in the more typical (nonepisodic) winters of 1965-1972. Consideration of the acid aerosol data was of special interest because this chemical component has been suspected as a causal agent in past episodes. Temporal lag structures between the variables were examined after removal of long-term components from each series in order to obtain 'rational' cross-correlations. Significant associations between same-day and lagged pollution variables and mortality were found. Alternative regression models with pollution and weather variables were also developed. The coefficients obtained were applied to the 1962 pollution episode to examine the continuity of the estimated slopes. The pollution-predicted deaths fit the observed deaths well, which supports the applicability of such deviation-derived coefficients to the absolute scale. These models were also employed to estimate mean excess daily deaths attributed hypothetically to air pollution. On average, mean effect ranged from 2-7% of all deaths during the nonepisodic winters in Greater London, but the 95% confidence intervals of these estimates overlapped for all model specifications examined. This estimated pollutant mixture 'effect' cannot be attributed to a particular pollutant because of a lack of quantitative information on the relative downward biases caused by both analytical errors and errors in the spatial representativeness of each respective pollution index
— id: 10382, year: 1993, vol: 48, page: 213, stat: Journal Article,

An automated sequential sampling system for particulate acid aerosols: description, characterization, and field sampling results
Thurston GD; Gorczynski JE Jr; Jaques P; Currie J; He D
1992 Oct-Dec;2(4):415-428, Journal of exposure analysis & environmental epidemiology
An automated sequential sampling system for the measurement of particulate acid aerosols was developed in order to allow the routine collection of daily samples with only once-per-week site visits. The system's design, operation, and associated quality assurance (QA), quality control (QC), and data validation procedures are described. Results from a multi-year field application of this system in the Buffalo, Albany, and New York City metropolitan areas are reported, as well as from external audits and interlab analytical intercomparisons. It is found that the system successfully collected 94% of all possible samples in these three cities between May 1988 and December 1989. Weekly QA field blanks and positive control filters indicate that these data were collected with negligible acid contamination or neutralization. Peak aerosol acidity levels at these sites were found to be highest during the summer months, with peak 24-hr average levels in the 300-400 nmol/m3 range. It is concluded that this system represents a more convenient means of collecting extended daily records of valid particulate acid aerosol concentrations than has been possible in the past
— id: 10394, year: 1992, vol: 2, page: 415, stat: Journal Article,

A multi-year study of air pollution and respiratory hospital admissions in three New York State metropolitan areas: results for 1988 and 1989 summers
Thurston GD; Ito K; Kinney PL; Lippmann M
1992 Oct-Dec;2(4):429-450, Journal of exposure analysis & environmental epidemiology
As part of a multi-year study of air pollution and respiratory hospital admissions in the Buffalo, Albany, and New York City, New York, metropolitan areas, filter samples were collected daily at suburban air monitoring sites and analyzed for their content of particulate phase aerosol strong acidity (i.e., hydrogen ion, H+) and sulfate (SO4 = ). In addition, daily hospital admissions for respiratory causes, other community air pollutant measurements (e.g., ozone, O3), and meteorological data (e.g., temperature) were also obtained for these metropolitan areas. The summer months (June-August) were selected for analysis because that is when the highest H+ (and O3) are usually experienced at these sites, and because these months are rarely complicated by other major influences (e.g., high pollen counts). Thus, any pollution-admissions relationships were expected to be most clearly discernible in this season. Prior to the health effects analysis, the summer admissions and environmental data were first detrended to eliminate long-wave autocorrelations, and day-of-week effects were removed via regression. Cross-correlations of the filtered 1988 and 1989 admissions and environmental data revealed strong associations between elevated summer haze pollution (i.e., H+, SO4 =, and O3) and increased total respiratory and asthma admissions on the same day and/or on subsequent days in Buffalo and New York City, especially during the summer of 1988 (when pollution levels were more extreme). Regression analyses indicated that the pollution-admissions associations remained significant (p < 0.05) even after the simultaneous inclusion of lagged daily maximum temperature. Mean effects calculations for these cities indicated that summertime haze can play a significant role in the occurrence of respiratory admissions in that season: accounting for an average 6 to 24% of 1988 Buffalo and NYC asthma admissions (depending on the pollutant index employed). O3 consistently had the highest mean effects estimates. Relative risk (RR) calculations indicated that the risk of admission for asthma was increased by a factor of 1.19 to 1.43 in these cities on maximum 1988 summertime pollution days, with H+ consistently having the highest RR estimates. These results are consistent with the hypothesis that ambient acid aerosol peaks (e.g., H+ > or = 100 nmol/m3) can potentiate the respiratory disease effects of O3. Associations were weaker in the less urbanized Albany metropolitan area and in the New York City (NYC) suburbs, even though the NYC suburban O3 exposures were similar to (and the H+ concentrations may even be somewhat higher than) those in the center city.(ABSTRACT TRUNCATED AT 400 WORDS)
— id: 8256, year: 1992, vol: 2, page: 429, stat: Journal Article,

Air pollution and mortality
Thurston, G D; Ozkaynak, H
1992 Jan 24;255(5043):382-383, Science
— id: 72119, year: 1992, vol: 255, page: 382, stat: Journal Article,

Effects of heavy industrial pollution on respiratory function in the children of Cubatao, Brazil: a preliminary report
Spektor DM; Hofmeister VA; Artaxo P; Brague JA; Echelar F; Nogueira DP; Hayes C; Thurston GD; Lippmann M
1991 Aug;94:51-54, Environmental health perspectives
Under a cooperative agreement between New York University and the Environmental Protection Agency, and in collaboration with the University of Sao Paulo (USP), a study is ongoing in Cubatao, Brazil, to try to establish exposure-response relationships on the impact of specific industrial effluents on respiratory function in school-age children. Cubatao, located on the coast about 44 km from the city of Sao Paulo, is surrounded by U-shaped mountains (approximately 800 m) covered with subtropical forests. Its area is approximately 160 km2, and it has a population of approximately 90,000. The geography is such that it causes a consistent diurnal land-sea breeze pattern and the opposite during the night, with low dispersion of the air pollutants. In a small area (approximately 40 km2) against the mountains there is a concentration of over 20 large plants: oil refinery; iron and steel mill; fertilizer, cement, and gypsum production; coke kilns; and chemical, paint, and many other ancillary plants. During the 1988 school year, March through June, August through November, 600 six-year-old children, attending six different kindergarten schools, underwent monthly spirometry tests. Because the children live within a 500 m radius of their school, pollution monitors were located on each of the six schools. Particles were collected using dichotomous stacked filter units placed on 20 m towers to reduce the influence of dust from unpaved roads. The units use different pore size filters for coarse, 2 to 10 microns, and fine particles, (dp) less than 2 microns, and took separate samples for day and nighttime.(ABSTRACT TRUNCATED AT 250 WORDS)
— id: 13945, year: 1991, vol: 94, page: 51, stat: Journal Article,

Effects of single- and multiday ozone exposures on respiratory function in active normal children
Spektor DM; Thurston GD; Mao J; He D; Hayes C; Lippmann M
1991 Aug;55(2):107-122, Environmental research
Ventilatory function was measured twice daily on 46 healthy children aged 8-14 years on at least 7 days for each child during a 4-week period at a northwestern New Jersey residential summer camp in 1988. The highest 1-hr O3 concentration was 150 ppb, while the highest 12-hr H+ concentration (as H2SO4) was 18.6 micrograms/m3. The highest temperature-humidity index was 81 degrees F. The regressions of FVC, FEV1, FEF25-75, and PEFR on O3 in the hour preceding the afternoon function measurements yielded slopes essentially the same as those measured on other children at the same camp in 1984. Regressions of the changes in function between the late morning and late afternoon function measurements on average O3 concentration between them produced significant, but somewhat smaller effects, while regressions of morning function on O3 during the previous day indicated small but still significant effects. There were no significant correlations with other measured environmental variables including H+. Based on the results of this study and similar previous studies, we conclude that O3 exposures in ambient air produce greater lung function deficits in active young people in natural settings then does pure O3 in controlled chamber exposure studies because of: (1) longer exposures; (2) potentiation by other factors in the ambient exposures; (3) the persistence of effects from prior day's exposures; and (4) the persistence of a transient response associated with the daily peak of exposure. It follows that projections of likely effects in the real world from controlled chamber exposure studies should either have a large margin of safety, or the judgment of the extent of effects likely to occur among populations should be based directly on the effects observed in field studies
— id: 13952, year: 1991, vol: 55, page: 107, stat: Journal Article,

MEASUREMENTS OF SULFATE AEROSOL AND ITS ACIDITY IN THE SO2 SOURCE REGION OF CHESTNUT-RIDGE, PA
Waldman, JM; Liang, SKC; Lioy, PJ; Thurston, GD; Lippmann, M
1991 Jun;25(7):1327-1333, Atmospheric environment. Pt. B. Urban atmosphere
A study of acidic sulfate aerosol was conducted at two sites (8 km apart) along Chestnut Ridge in western Pennsylvania during November 1987. Fine (< 2.5-mu-mad) aerosol composition was measured using dichotomous samplers with Teflon membrane filters. Three 8-h samples per day were collected for 10 days. The major species were SO4(2-) and NH4+, which averaged about 95 and 70 neq m-3, respectively, at both sites. The particulate acidity was less than 15 per cent of sulfate equivalents; the averages were 6-14 neq m-3 (< 1.0-mu-g m-3 as H2SO4). Acidity exceeded this level only 30% of the sampling intervals at one site, with the peak value almost-equal-to 50 neq m-3. This site received a higher frequency of upper level winds from the direction of several nearby coal-fired power plants (the nearest 5 km away), and the period of highest acidity was observed concurrently with elevated SO2. The 3 x daily data suggest that higher acidity occurred in the overnight period (midnight to 8 a.m.) in the late fall, while sulfate had its highest levels in the morning to afternoon period
— id: 32178, year: 1991, vol: 25, page: 1327, stat: Journal Article,

SPATIAL AND TEMPORAL PATTERNS IN SUMMERTIME SULFATE AEROSOL ACIDITY AND NEUTRALIZATION WITHIN A METROPOLITAN AREA
Waldman, JM; Lioy, PJ; Thurston, GD; Lippmann, M
1990 Apr;24(1):115-126, Atmospheric environment. Pt. B. Urban atmosphere
— id: 31882, year: 1990, vol: 24, page: 115, stat: Journal Article,

Characterization and reconstruction of historical London, England, acidic aerosol concentrations
Ito K; Thurston GD
1989 Feb;79:35-42, Environmental health perspectives
Several past studies of the historical London air pollution record have reported an association between daily mortality and British Smoke levels. However, this pollution index does not give direct information on particulate mass or its chemical composition. A more specific particulate matter index, aerosol acidity, was measured at a site in central London, and daily data are available for the period 1963-1972. British Smoke and SO2 were also measured at the same site. Also, meteorological parameters were routinely measured at a nearby British Meteorological Office. Thus, daily fluctuation of the acidic aerosols was characterized in terms of other environmental parameters. Each of the other parameters analyzed seems necessary, but not sufficient to explain a high level of acidic aerosol. Overall, about half of the variance of log-transformed daily fluctuations of acidic aerosols can be explained by a combination of parameters including SO2 and British Smoke concentrations, temperature, ventilation by wind, and humidity. The rest of the variance cannot be explained by the parameters included in this analysis. Potential factors responsible for this unique variance would be variations in the availability of basic gases to cause neutralization and variation in the availability of catalytic metal salts. Because the acidic aerosol has a unique component of variation, it may be possible to distinguish health effects due to this specific pollutant from other available pollution indices or environmental factors
— id: 10734, year: 1989, vol: 79, page: 35, stat: Journal Article,

Reexamination of London, England, mortality in relation to exposure to acidic aerosols during 1963-1972 winters
Thurston GD; Ito K; Lippmann M; Hayes C
1989 Feb;79:73-82, Environmental health perspectives
Air pollution epidemiology since the 1950s has been able to demonstrate that increases in daily mortality in London, England, were associated with elevated concentrations of index air pollutants, i.e., British Smoke (BS) and sulfur dioxide (SO2). In this work, we reanalyze that portion of the 1958-1972 winter mortality-pollution record for which daily direct acid aerosol measurements were made at a central site in London (St. Bartholomew's Medical College). The purposes of these exploratory analyses are to examine the dataset for indications of a relationship between acid aerosol pollution and human mortality and to compare any noted associations with those for other pollution variables. It is found that the log of acid aerosol concentrations is more strongly associated with raw total mortality in bivariate analyses than is BS or SO2, despite the fact that acid data are available from only one central site (versus seven disperse sites for BS and SO2). The logarithmic nature of the exposure side of the H2SO4-mortality relationship implies a saturation model of pollution effects, possibly due to multiday pollution harvesting influences on a susceptible subpopulation. Moreover, mortality-pollution cross-correlation analyses indicate that mortality effects usually follow pollution in time, supporting a causal relationship between the two. The apparent advantage of H2SO4 over BS in predicting total raw mortality is consistent with the hypothesis that it is the portion of particulate mass of greater health significance and may also allow the development of London mortality results which are more easily transferable to other environments than is the case for existing BS results
— id: 10727, year: 1989, vol: 79, page: 73, stat: Journal Article,

AN AUTOMATED SEQUENTIAL SAMPLING SYSTEM FOR PARTICULATE ACID AEROSOLS
THURSTON, GD; GORCZYNSKI, JE
1989 SEP 10 ;198(2):1-ENVR, Abstracts of papers (American Chemical Society)
— id: 98502, year: 1989, vol: 198, page: 1, stat: Journal Article,

Exposure assessment: input into risk assessment
Lippmann M; Thurston GD
1988 Mar-Apr;43(2):113-123, Archives of environmental health
The validity of a risk assessment can be no better than that of the exposure assessment upon which it is based. The general paucity of relevant exposure data, combined with the limited appreciation by most risk assessors of the critical dimensions and metrics of exposure, often leads to an overreliance on exposure models of questionable validity. The problems of identifying and interpreting relevant metrics of exposure for epidemiologic studies and risk assessments are illustrated through the presentation of three case studies. The first examines the effects of ozone on respiratory mechanical function and demonstrates that the appropriate averaging time is greater than or equal to 6 hr, rather than 1 hr, as is implied by the current ambient air quality standard. The second case study examines the effects of sulfur oxides and particulate matter in ambient air on morbidity and mortality. It indicates that the effects are most closely associated with the acidity of the aerosol, providing a basis for an index of exposure more relevant than those currently used, i.e., sulfur dioxide and nonspecific gravimetric mass concentration of particulate matter. The third case study examines the effects of lead on blood pressure. It shows that blood lead in concentrations below 35 micrograms/dL correlates with blood pressure in both humans and animals independently of other known causal factors for blood pressure elevation. It also examines the variable relations between levels of lead in blood and in environmental media to illustrate the potential problems which can arise from the use of biological markers, such as lead in blood, as indices of exposure
— id: 11168, year: 1988, vol: 43, page: 113, stat: Journal Article,

Effects of ambient ozone on respiratory function in active, normal children
Spektor DM; Lippmann M; Lioy PJ; Thurston GD; Citak K; James DJ; Bock N; Speizer FE; Hayes C
1988 Feb;137(2):313-320, American review of respiratory disease
Respiratory functions were measured on a daily basis by spirometry over a period of 4 wk at a summer camp at Fairview Lake in northwestern New Jersey. Fifty-three boys and 38 girls 8 to 15 yr of age participated in the study on at least 7 days; 37 children were in residence for 4 wk, 34 for the first 2 wk only; and 20 for the last 2 wk. There were 72 whites, 15 blacks, 3 Asians, and 1 Hispanic in the study group. Multiple regression analyses indicated that the O3 concentration in the previous hour, the cumulative daily O3 exposure during the hours between 9 A.M. and the function measurement, ambient temperature, and humidity were the most explanatory environmental variables for daily variations in function, with the 1 - h O3 concentration having the strongest influence. Linear regressions were performed for each child between O3 concentration and function, and all average slopes were significantly negative (p less than 0.05) for FVC, FEV1, PEFR, and FEF25-75 for all children, and for boys and girls separately. Comparable results were obtained in data subsets (i.e., children studied during the first or second 2 wk only, and for data sets truncated at O3 less than 80 and O3 less than 60 ppb). The average regression slopes (+/- SE) for FVC and FEV1, respectively, were -1.03 +/- 0.24 and -1.42 +/- 0.17 ml/ppb, whereas for PEFR and FEF25-75 they were -6.78 +/- 0.73 and -2.48 +/- 0.26 ml/s/ppb.(ABSTRACT TRUNCATED AT 250 WORDS)
— id: 11188, year: 1988, vol: 137, page: 313, stat: Journal Article,

Effects of ambient ozone on respiratory function in healthy adults exercising outdoors
Spektor DM; Lippmann M; Thurston GD; Lioy PJ; Stecko J; O'Connor G; Garshick E; Speizer FE; Hayes C
1988 Oct;138(4):821-828, American review of respiratory disease
The effect of exposure to ozone (O3) in ambient air on respiratory function was studied in 30 healthy adult nonsmokers engaged in a regular daily program of outdoor exercise in Tuxedo, NY during the summer of 1985. Each subject did the same exercise each day, but exercise intensity and duration varied widely between subjects, with minute ventilation ranging from 20 to 153 L and duration ranging from 15 to 55 min. Spirometry was performed immediately before and after each exercise period. O3 concentrations during exercise ranged from 21 to 124 parts per billion (ppb). All measured functional indexes showed significant (p less than 0.01) O3-associated mean decrements with FVC at -2.1 ml/ppb, FEV1 at -1.4 ml/ppb, PEFR at -9.2 ml/s/ppb, FEF25-75 at -6.0 ml/s/ppb, and FEV1/FVC at -0.038%/ppb. Mean decrements were smaller for 10 subjects with minute ventilations greater than 100 L than for 10 other subjects with minute ventilations between 60 and 100 L or for the 10 subjects with minute ventilations below 60 L. Overall, the functional decrements were similar in magnitude to those we have seen in children engaged in supervised recreational programs in summer camps. For 10 subjects with minute ventilations comparable to those used in controlled 1- and 2-h exposures to O3 in purified air in chambers (50 to 80 L), the effects were about twice as large as those reported for the chamber studies.(ABSTRACT TRUNCATED AT 250 WORDS)
— id: 10941, year: 1988, vol: 138, page: 821, stat: Journal Article,

Associations between 1980 U.S. mortality rates and alternative measures of airborne particle concentration
Ozkaynak, H; Thurston, G D
1987 Dec;7(4):449-461, Risk analysis
We analyzed the 1980 U.S. vital statistics and available ambient air pollution data bases for sulfates and fine, inhalable, and total suspended particles. Using multiple regression analyses, we conducted a cross-sectional analysis of the association between various particle measures and total mortality. Results from the various analyses indicated the importance of considering particle size, composition, and source information in modeling of particle pollution health effects. Of the independent mortality predictors considered, particle exposure measures related to the respirable and/or toxic fraction of the aerosols, such as fine particles and sulfates, were most consistently and significantly associated with the reported SMSA-specific total annual mortality rates. On the other hand, particle mass measures that included coarse particles (e.g., total suspended particles and inhalable particles) were often found to be nonsignificant predictors of total mortality. Furthermore, based on the application of fine particle source apportionment, particles from industrial sources (e.g., from iron/steel emissions) and from coal combustion were suggested to be more significant contributors to human mortality than soil-derived particles
— id: 72120, year: 1987, vol: 7, page: 449, stat: Journal Article,

RECEPTOR MODELING AND AEROSOL TRANSPORT
THURSTON, GD; LIOY, PJ
1987 MAY ;21(3):687-698, Atmospheric environment (Oxford)
— id: 98537, year: 1987, vol: 21, page: 687, stat: Journal Article,

A QUANTITATIVE ASSESSMENT OF SOURCE CONTRIBUTIONS TO INHALABLE PARTICULATE MATTER POLLUTION IN METROPOLITAN BOSTON - REPLY
THURSTON, GD; SPENGLER, JD
1987 JAN ;21(1):259-260, Atmospheric environment (Oxford)
— id: 98545, year: 1987, vol: 21, page: 259, stat: Journal Article,

EXPOSURE MONITORING FOR ATMOSPHERIC ACIDIC AEROSOLS
Lioy, PJ; Thurston, GD; Lippmann, M
1985 ;190(SEP):59-, Abstracts of papers (American Chemical Society)
— id: 30849, year: 1985, vol: 190, page: 59, stat: Journal Article,

Consideration of risk analysis in the revision of the primary standards for ambient particles
Ozkaynak, Haluk; Spengler, John D; Thurston, George D.
Case studies in risk assessment and management [S.l.] : Air Pollution Control Association, 1985,
— id: 4282, year: 1985, vol: , page: ?, stat: Chapter,

Tracing Aerosol Pollution
Thurston GD; Laird NM
1985 Mar 22;227(4693):1406-1407, Science
— id: 96454, year: 1985, vol: 227, page: 1406, stat: Journal Article,

A QUANTITATIVE ASSESSMENT OF SOURCE CONTRIBUTIONS TO INHALABLE PARTICULATE MATTER POLLUTION IN METROPOLITAN BOSTON
THURSTON, GD; SPENGLER, JD
1985 JAN 20 ;19(1):9-25, Atmospheric environment (Oxford)
— id: 98580, year: 1985, vol: 19, page: 9, stat: Journal Article,

A source apportionment of particulate air pollution in metropolitan Boston
Thurston, George D
[S.l. : s.n.], 1983,
Thesis (D.Sc.) -- Harvard School of Public Health, 1983
— id: 1231, year: 1983, vol: , page: , stat: ,

Source contributions to inhalable particulate matter in Metropolitan Boston, Massachusetts
Thurston, George D; Spengler, John D
New Orleans : Air Pollution Control Association, 1982,
— id: 1230, year: 1982, vol: , page: , stat: ,